
U.S. Corporate Bonds: Yields Rise, Spreads Hold Steady
U.S. corporate bonds lost approximately 3.5% between September 8 and October 5, while credit risk pricing changed little. The main driver was the rise in government bond yields, which affected investment-grade corporate bonds and 7–10-year Treasuries to a similar extent. Credit spreads—the additional yield companies pay over government bonds—increased mainly in the high-yield segment. However, they remain close to their three-year averages. Our health scores, by contrast, are among the lowest recorded over the past ten years, pointing to weak conditions with an 80% probability of persistence.
From 4.80% to 5.31%: The 10-Year Treasury Yield Surges
The U.S. 10-year Treasury yield rose from 4.80% on September 8 to 5.31% on October 5. The sharpest move occurred on September 23 and 24, when the yield climbed from 4.96% to 5.18% in just two sessions. On October 6, it eased to 5.27%.
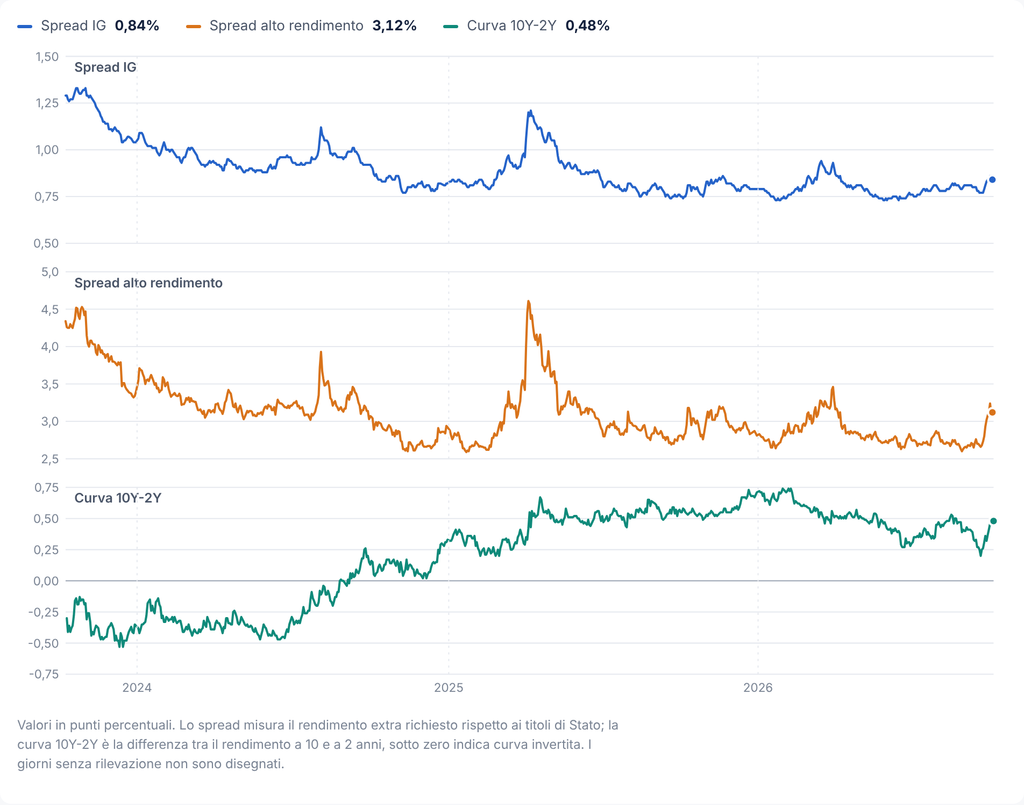
The increase reshaped the yield curve. The spread between 10-year and 2-year Treasury yields stood at 0.51 percentage points on August 14 before narrowing to 0.20 on September 21. Since then, the 10-year yield has risen by 31 basis points, while the 2-year yield has increased by just 3 basis points, bringing the gap back to 0.48 percentage points. The long end of the curve has been the main driver of the move.
Bond prices generally fall as yields rise, with longer-duration securities experiencing greater price sensitivity. U.S. Treasuries with maturities of 7–10 years and investment-grade corporate bonds have similar average maturities and both lost 3.5%. High-yield corporate bonds, with shorter average maturities, declined by 2.7%.
Credit Spreads Have Moved Only Modestly
The investment-grade corporate spread stood at 0.84% on October 5, compared with 0.77% on September 23. Its recent peak was 0.86% on October 1. The three-year average is 0.89%, while the spread has ranged between 0.73% and 0.94% in 2026.
The move has been more pronounced in high yield. Spreads widened from 2.68% on September 22 to 3.12% on October 5, reaching a peak of 3.24% on October 1. This represents a 44-basis-point increase in just two weeks. The current level is broadly in line with the three-year average of 3.10% and remains well below the April 2025 high of 4.61%. The highest level recorded in 2026 was 3.46%.
Credit stress typically manifests itself through broad-based spread widening and accelerating volatility. At present, we see only partial evidence of the former, while the latter is absent. The U.S. equity volatility index stood at 15.5 on October 5, remaining within the 14.2–17.8 range observed since mid-August.
Health Scores: Weak and Stable Conditions
The health score for investment-grade corporate bonds stands at 37.2, while the high-yield score is 36.2.
🔒 Subscriber-only content. Activate 14-day free trial or Login here