The financial markets
barometer
Technical and intermarket analysis on over 100 financial assets. Every day. Independent.
Plus weekly insights, outlook, and asset allocation.
Risk Off
Neutral
Risk On
Neutral
Current
44 / 100
Score
▼
-0.255
7-day change
Low
Medium
High
Medium
Current
35 / 100
Score
→
+0.001
7-day change
Market Weather
Score & 7-day change by asset class
Stocks
⛅
Cloudy
52.3
/100
↗
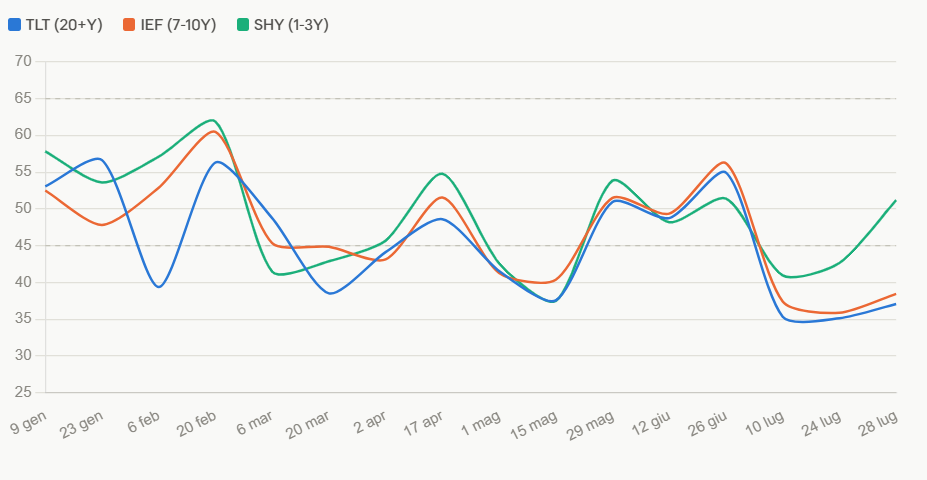
Bonds
🌧️
Rainy
41.9
/100
→
Commodities
⛅
Cloudy
52.2
/100
↘
Others
⛅
Cloudy
48.4
/100
▼
Markets Today
Latest daily report
31 Jul 2026
Markets Hold Neutral Bias as Earnings and Macro Data Send Mixed Signals; FX Draws Attention
The week is drawing to a close with financial markets remaining in a neutral environment, showing limited directional conviction. The latest earnings…
Read analysis →

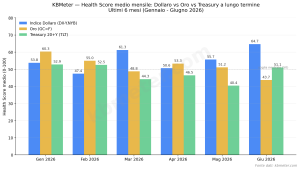
Asset Allocation

Monthly Statistics: JULY 2026