
Rates Drive Intermarket Signals as U.S. Private-Sector Confidence Remains Weak
The U.S. 10-year Treasury yield reached 5.31% on October 5, its highest level of the year, while August inflation stands at 3.4% year-on-year. Against this backdrop, the three ratios we use to measure private-sector confidence have responded consistently: consumer spending remains stagnant, small-cap stocks are losing ground, while copper is holding its ratio against gold as gold retreats.
Consumer spending: cyclical and defensive sectors are falling together
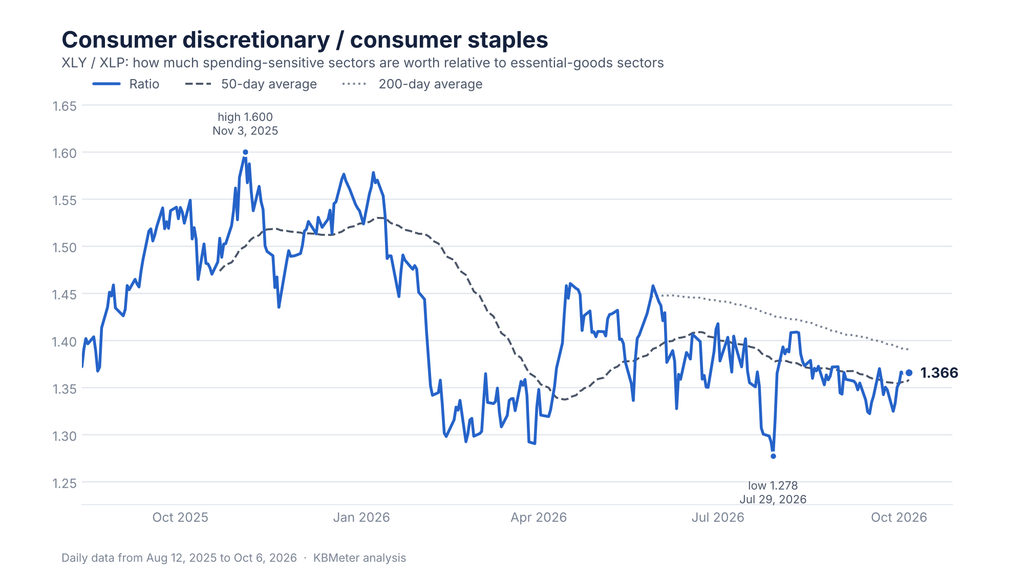
The ratio between consumer cyclical sectors (those that depend on consumers’ willingness to spend) and consumer defensive sectors (those focused on essential goods) stands at 1.37. It has moved between 1.28 and 1.42 since April, with no clear direction. The ratio is down 11.2% year-to-date, and the 50-day moving average remains below the 200-day moving average.
The sideways movement masks a clearer picture. Relative to the S&P 500, both sectors are at their lowest levels of the past 13 months: cyclicals have fallen 2.8% over the past month and defensives 3.3%, while the index has risen 1.2%. The ratio between the two has remained unchanged because both have declined by roughly the same amount.
The U.S. consumer has not opted for caution. Instead, the entire consumer sector is lagging behind.
Size: small caps are bearing the brunt of higher rates
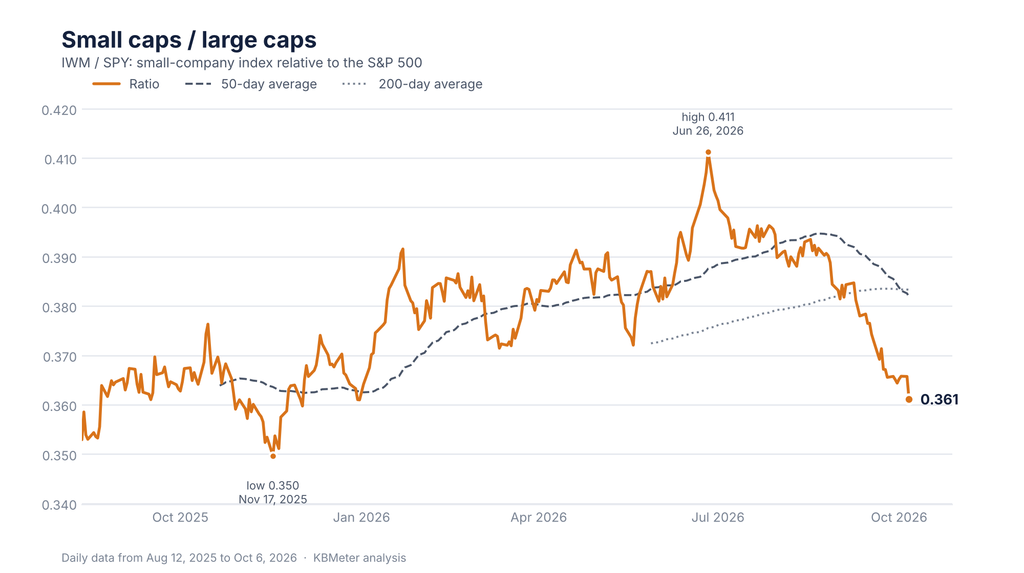
The ratio between small- and large-cap stocks stands at 0.361, its lowest level since November 17, 2025. From its June 26 peak, it has fallen 12.2%. Since June, small caps have declined 5.7%, while large caps have gained 4.7%.
Listed small companies rely heavily on short-term, floating-rate debt and are therefore more sensitive to the cost of borrowing. The data are consistent with this interpretation: over the past three months, days of rising yields have coincided with declines in both small- and large-cap stocks, with the relationship somewhat stronger for small caps.
Year-to-date, the ratio has returned to its December 31 level, as both categories have risen 14.3%. The advantage accumulated in the spring has been wiped out in just a few weeks.
Copper and gold: the ratio remains high because gold is falling
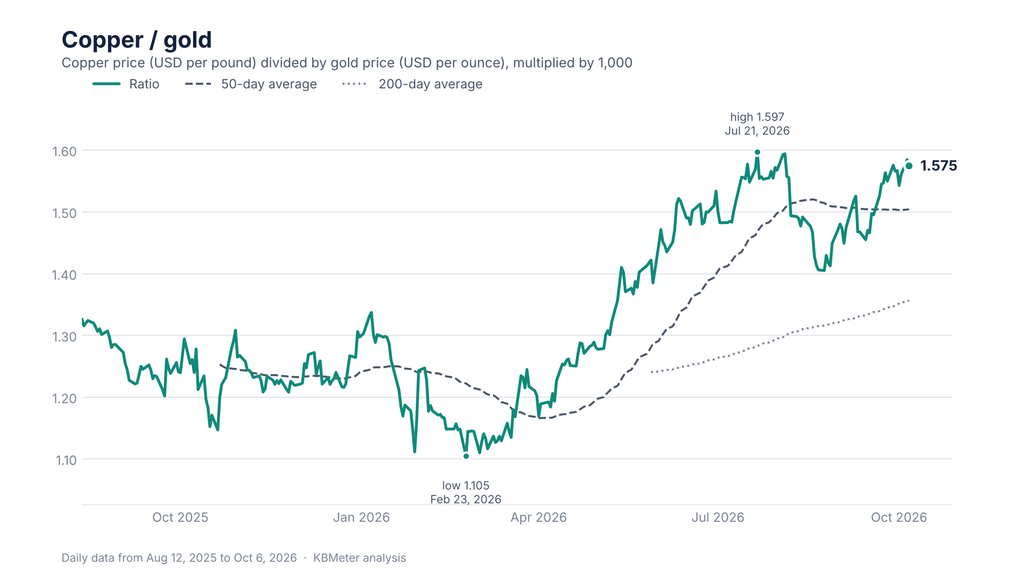
The copper-to-gold price ratio stands at 1.58, close to its 13-month high of 1.60, reached on July 21. Copper played a leading role through July: it gained 3.7% since June and 17.1% year-to-date, in a growth-oriented environment. It then stopped rising and has fallen 3.1% from its September 9 peak.
Since the end of August, the ratio has continued to strengthen for another reason. Gold has lost 10.9% since August 24, falling from $4,698 to $4,187 an ounce. Over the same period, the dollar index has risen 3.1% and yields have increased.
Gold, which pays no interest, is affected by both moves. Copper is therefore keeping the ratio elevated because its counterpart has weakened more sharply.
Consumer confidence
The September consumer confidence index fell to 48.1, from 51.7 in August (55.1 a year ago). This is its lowest level since May. Current conditions stand at 50.9, while expectations are at 46.3.
Among the concerns cited by households are high prices and trade disputes. The reading is consistent with the consumption data: limited willingness to spend, and confidence that has yet to recover.