
US Midterms Keep Markets on Edge; Europe Stocks Rebound as Commodities Slow
The day of the US midterm elections opens with financial markets sending signals of caution, as overall sentiment remains between neutral and mildly negative. On the one hand, Apple’s quarterly results fail to impress; on the other, hopes of negotiations in the Middle East are curbing the rally in oil prices. Equities remain in neutral territory, with Europe showing stronger readings than North America, while the technology sector struggles (the Nasdaq 100 is in correction territory). Commodities are showing signs of slowing momentum, while fixed income remains in neutral territory.
As investors await the election results, attention is turning to AMD’s earnings and the latest US job openings figures. Futures point to a slightly negative opening in the US and a positive start in Europe.
Market Weather Map
November 3, 2026
US Equities
Eu Equities
Asia Equities
Commodities
Bonds
Dollar Index
Technology
Gold
Oil
Crypto
Market Summary
Do you want to see the score details for all assets monitored by KBMeter?
Try free for 14 days →Financial markets sentiment
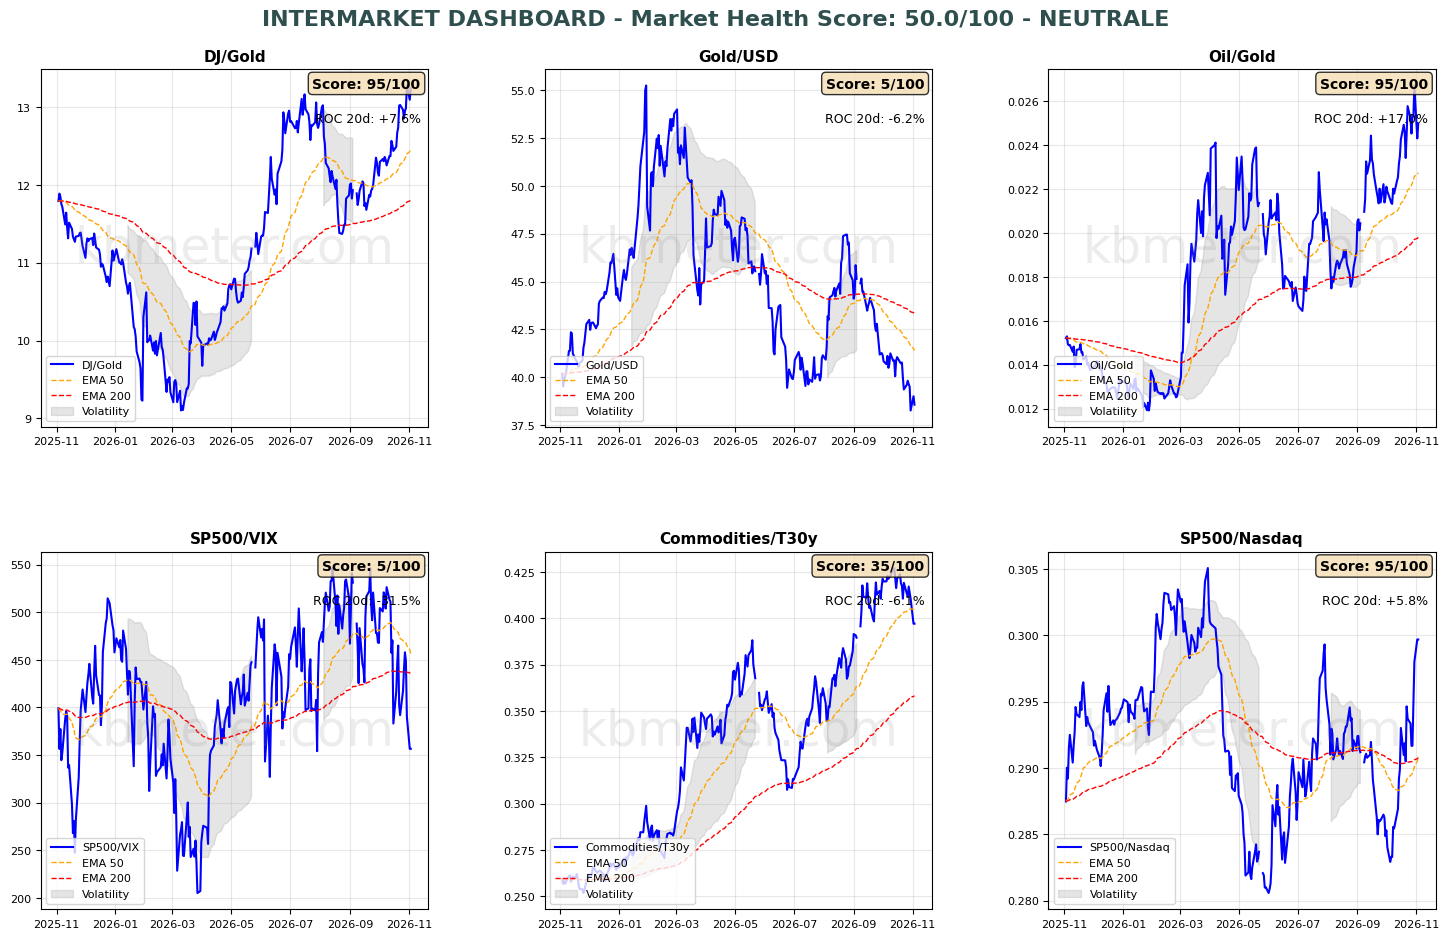
Financial markets are showing neutral to mildly negative sentiment today. Intermarket analysis puts the Market Health Score at 50/100. Our intermarket dashboards confirm a significant deterioration in market sentiment. The S&P 500/VIX ratio has slipped to its lowest level since last July, while the S&P 500/Nasdaq ratio has surged to its highest level since last July.
For the first time since last May, the Commodities/Bonds ratio has broken below its medium-term moving average, partly reflecting renewed strength in long-dated government bonds. This is happening while gold continues to underperform both the US dollar and the Dow, which has itself fallen below the 50-point score threshold.
In short, inflationary and interest rate pressures have not eased, but the loss of momentum in the technology sector is significantly dampening risk appetite, making US Treasuries attractive once again.
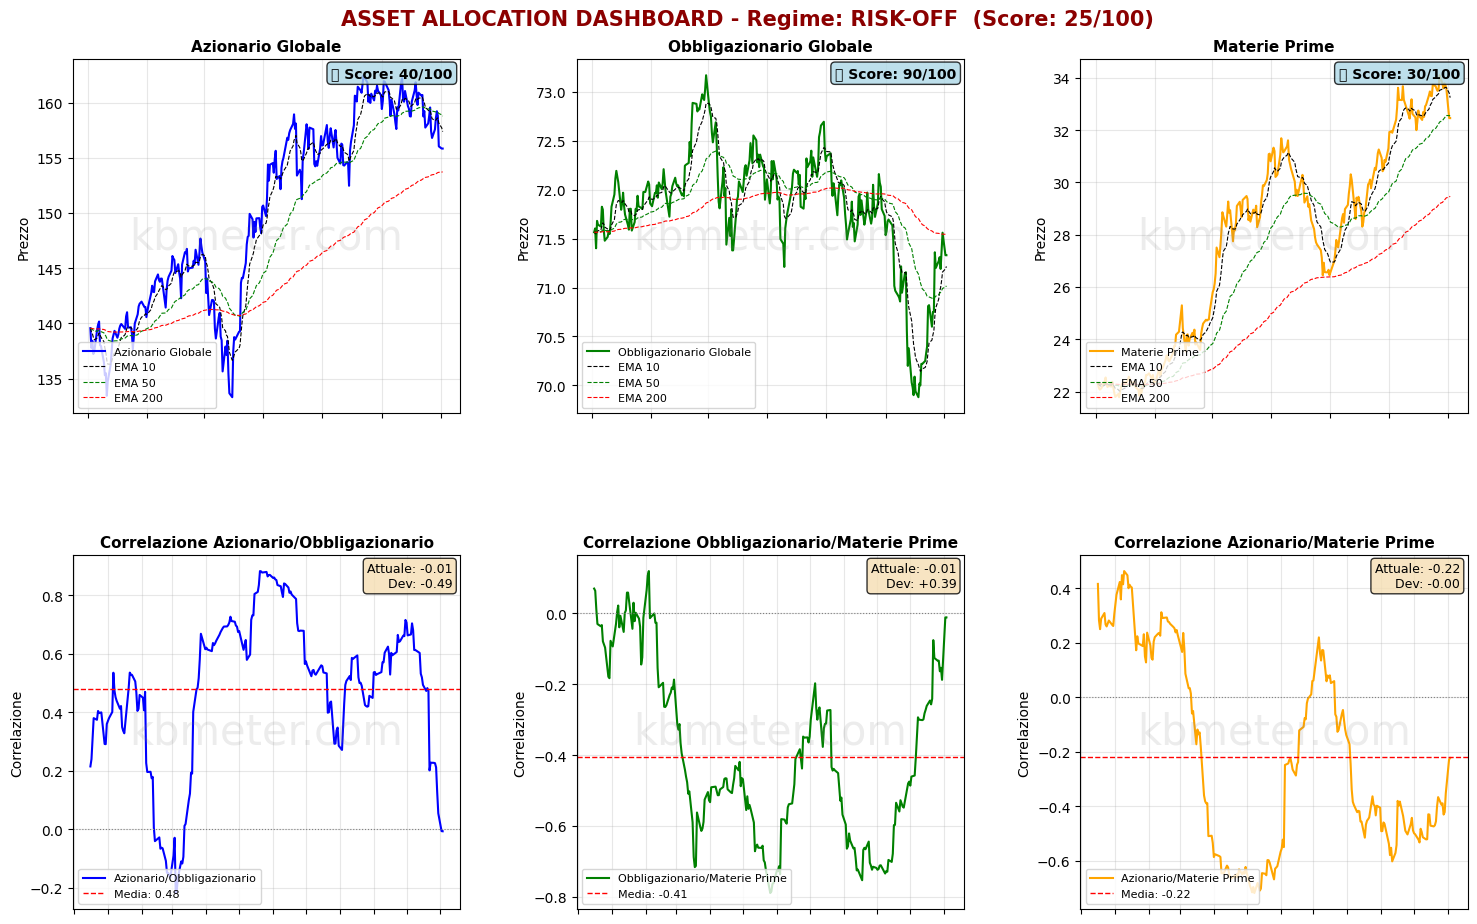
The performance of the various asset classes is particularly noteworthy. Global bonds have been rejected at resistance represented by their long-term moving average, while global equities remain within their medium-term support zone, above the long-term moving average. Diplomatic efforts in the Middle East are slowing the rally in oil prices, allowing commodities to consolidate around their medium-term moving average. This is another interesting development that warrants close monitoring over the coming days.
Although only marginally, the correlation between global equities and bonds has returned to negative territory.
Our market weather map continues to confirm that equities remain in neutral territory, with Europe outperforming North America and the S&P 500 technology sector well below the 50-point threshold. The US dollar remains strong, while oil prices are slipping towards the 50-point threshold. Gold remains in weak territory, while commodities are hovering near the lower end of the neutral range.
Looking at weekly movements, European equity markets stand out for their recovery, particularly Milan and Madrid. On the other hand, the Dow has lost 14 score points over the past seven days.
Global Futures – Pre-Market Sentiment
Pre-Market Futures: Global futures point to a moderately risk-off sentiment (-0.21% on average), with US futures slightly lower (-0.17%), European futures slightly higher (+0.23%) and Asian futures marginally negative (-0.02%).
📊 Global Futures – Pre-Market Sentiment
Macroeconomic calendar
On the macroeconomic front, the day began with the Reserve Bank of Australia’s decision to raise interest rates, in line with expectations. Later today, the US will release September 2026 factory orders and job openings data.
As for corporate earnings, investors will be keeping a close eye today on Intesa Sanpaolo, AMD, Shopify and Pfizer.
Assets to watch
Data as of Nov 2, 2026We have split the KBMeter scores into three bands, depending on their value: Weak, Intermediate or Strong. Here you can see which bands are most at risk of changing over the next 5 days and which ones hold.
The number on the right is the share of similar past cases in which the band had changed after 5 days. The higher it is, the more likely it is to change. The arrow in the current band appears when the asset is close to the border with the neighbouring band.
CONTINUE READING. ACTIVATE YOUR 14-DAY FREE TRIAL NOW. CLICK HERE
Already a subscriber? Login here
It does not say whether the price will rise or fall and it is not investment advice.
Already a subscriber? Login here
NOTES AND WARNINGS
Data compiled by kbmeter.com. Analysis date: 3 November 2026 - 8:39 AM GMT+1
This content is provided for informational purposes only and should not be considered financial advice. All scores and assessments are based on the previous trading day’s closing prices. Futures indications refer to the date and time of the analysis.