
US July Inflation Cools Fed Hike Bets for September; Stocks, Gold Benefit as Bond Volatility Persists
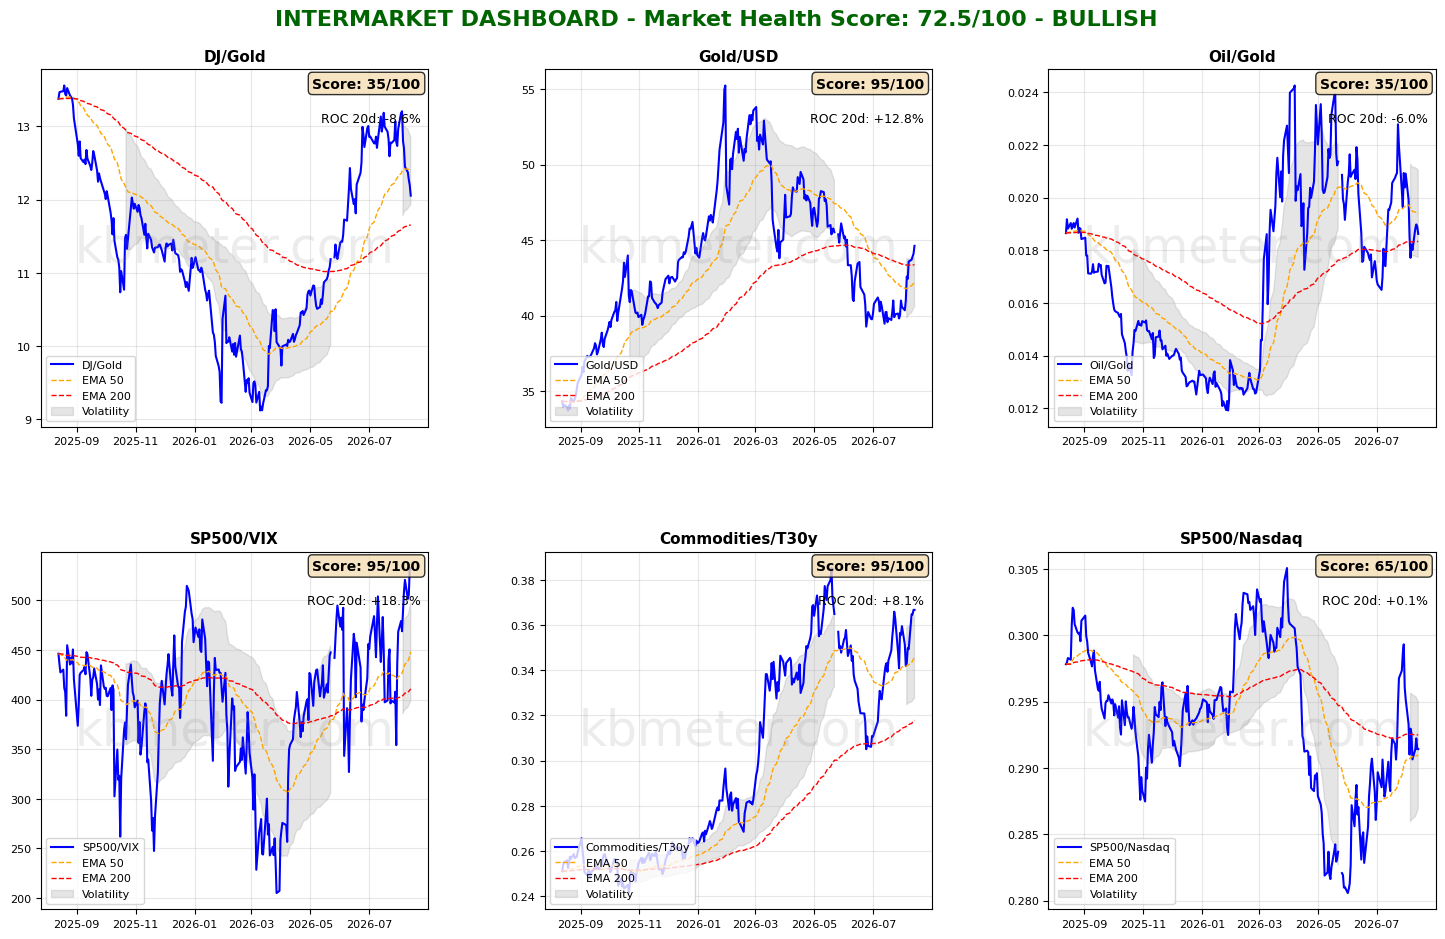
The US inflation figures for July 2026, broadly in line with expectations, reduce the likelihood of a Fed rate hike as early as next September. In financial markets, sentiment is strengthening into moderately positive territory. Gold remains in a phase of relative strength versus the US Dollar and the Dow, while geopolitical tensions continue to keep oil prices “hot” and the bond market highly volatile. Against this backdrop, the compression phase in the S&P 500/Nasdaq ratio continues, with the technology sector recovering into the 55-score area, benefiting from the latest investment rumors and remaining focused on Nvidia. Futures point to a higher opening for both European and US markets.
Market Weather Map
August 13, 2026
US Equities
Eu Equities
Asia Equities
Commodities
Bonds
Dollar Index
Technology
Gold
Oil
Crypto
Market Summary
Do you want to see the score details for all assets monitored by KBMeter?
Try free for 14 days →Financial markets sentiment
Financial markets are showing moderately positive sentiment today. Intermarket analysis highlights a Market Health Score of 72/100 (positive). There are few changes in our intermarket dashboards. The US inflation data have increased the likelihood that the Fed will remain on hold in September as well, while the Dollar/Gold ratio has moved further above its long-term moving average and the Dow/Gold ratio has fallen to its lowest level since late May. The Commodities/Bond ratio, however, remains around May levels, signaling that commodity prices are still biased to the upside. Sentiment remains moderately positive, while the compression of the S&P 500/Nasdaq ratio between the medium- and long-term moving averages continues.
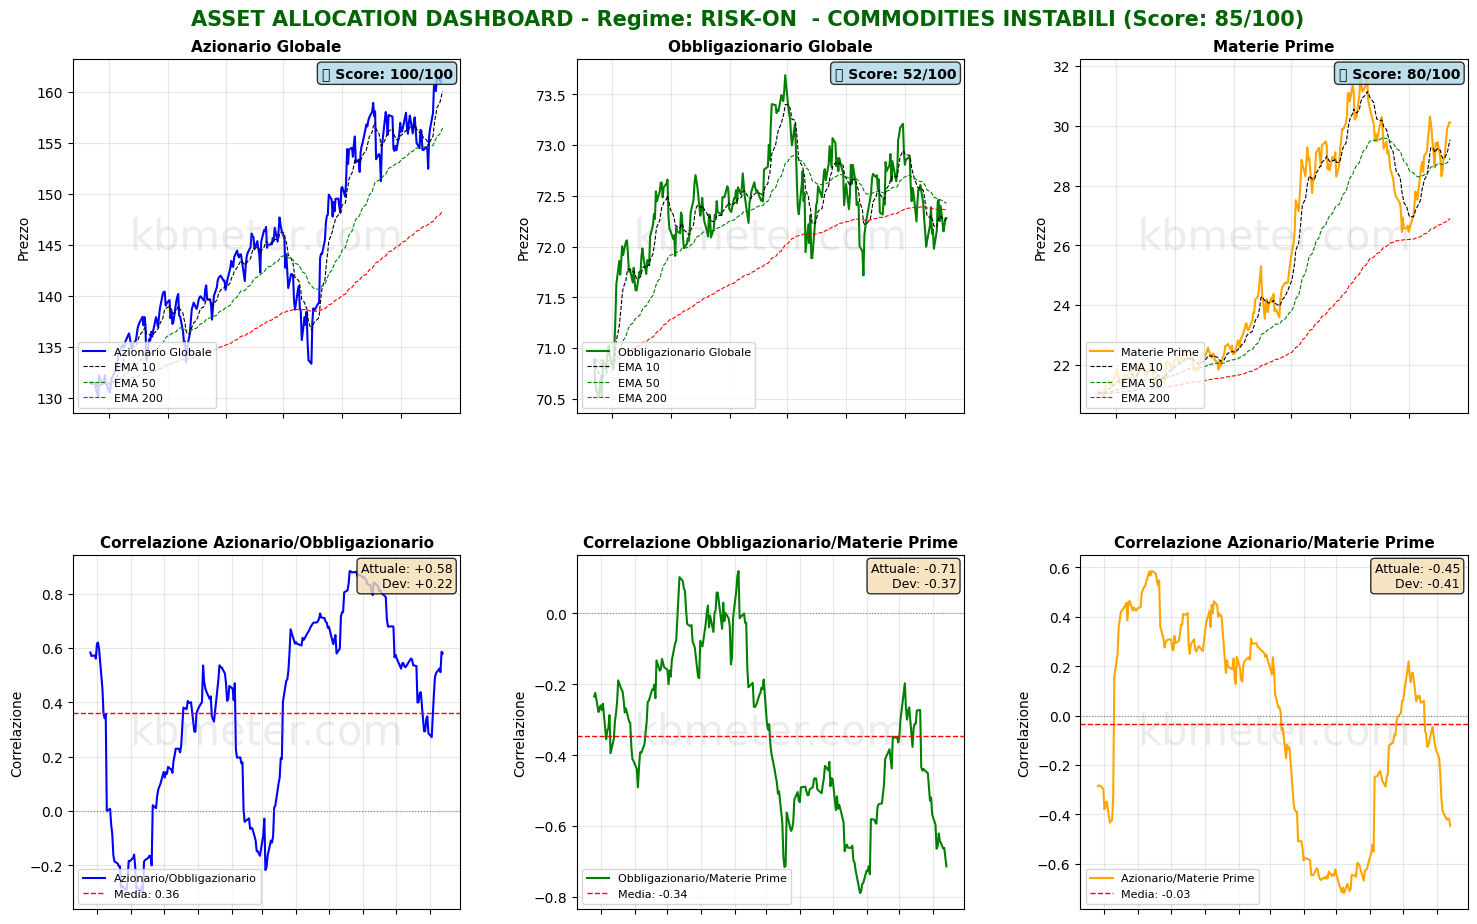
On the asset-class front, there are no major changes: equities remain in a short-term uptrend, while bonds are still weak below their medium- and long-term moving averages, which remain inverted. The correlation between commodities and bonds is moving back toward its one-year lows.
Our market “weather map” continues to show the equity sector in neutral to moderately positive territory. Oil has moved back above the 55-point threshold, while bonds, the Dollar and crypto remain below the 50-point threshold. In terms of daily and weekly changes, the sharp slowdown in the scores of the two main South American equity markets is worth noting. Argentina recorded a 5-point drop in its score in a single day, while Brazil lost almost 20 score points on a weekly basis. Among the strongest positive changes, the DAX stands out, gaining 6 score points in one day, along with bond market volatility, which gained 10 score points in a single day.
Global Futures – Pre-Market Sentiment
Pre-Market Futures: Global futures point to moderately risk-on sentiment (+0.28% on average), with the US slightly positive (+0.08%), Europe slightly positive (+0.19%), and Asia slightly positive (+0.28%).
📊 Global Futures – Pre-Market Sentiment
- Taiwan: +1.69%
- Hang Seng: +0.47%
- Euro Stoxx 50: +0.38%
- Dow: -0.01%
- Nikkei 225: +0.00%
- IBEX 35: +0.03%
Macroeconomic calendar
On the macro front, today’s agenda includes Japan’s producer price data, the performance of the UK economy in the second quarter of 2026, euro-area industrial production for June 2026, US producer prices for June 2026 and, also from the US, the latest update on initial jobless claims.
Already a subscriber? Login here
NOTES AND WARNINGS
Data compiled by kbmeter.com. Analysis date: 13 August 2026 - 8:28 AM GMT+1
This content is provided for informational purposes only and should not be considered financial advice. All scores and assessments are based on the previous trading day’s closing prices. Futures indications refer to the date and time of the analysis.
