
Uncertainty and Sector Rotation Weigh on the Technology Sector
Uncertainty and weak risk appetite are shaping financial markets in this first week of February. The most visible effect is a sector rotation that is weighing on technology stocks, despite earnings results so far being more than decent. Gold is rebounding after its recent slide and remains solid in terms of health score. Futures point to a weak open for Europe and a slightly positive start for the United States.
Market Weather Map
February 4, 2026
US Equities
Eu Equities
Asia Equities
Commodities
Bonds
Dollar Index
Technology
Gold
Oil
Crypto
Market Summary
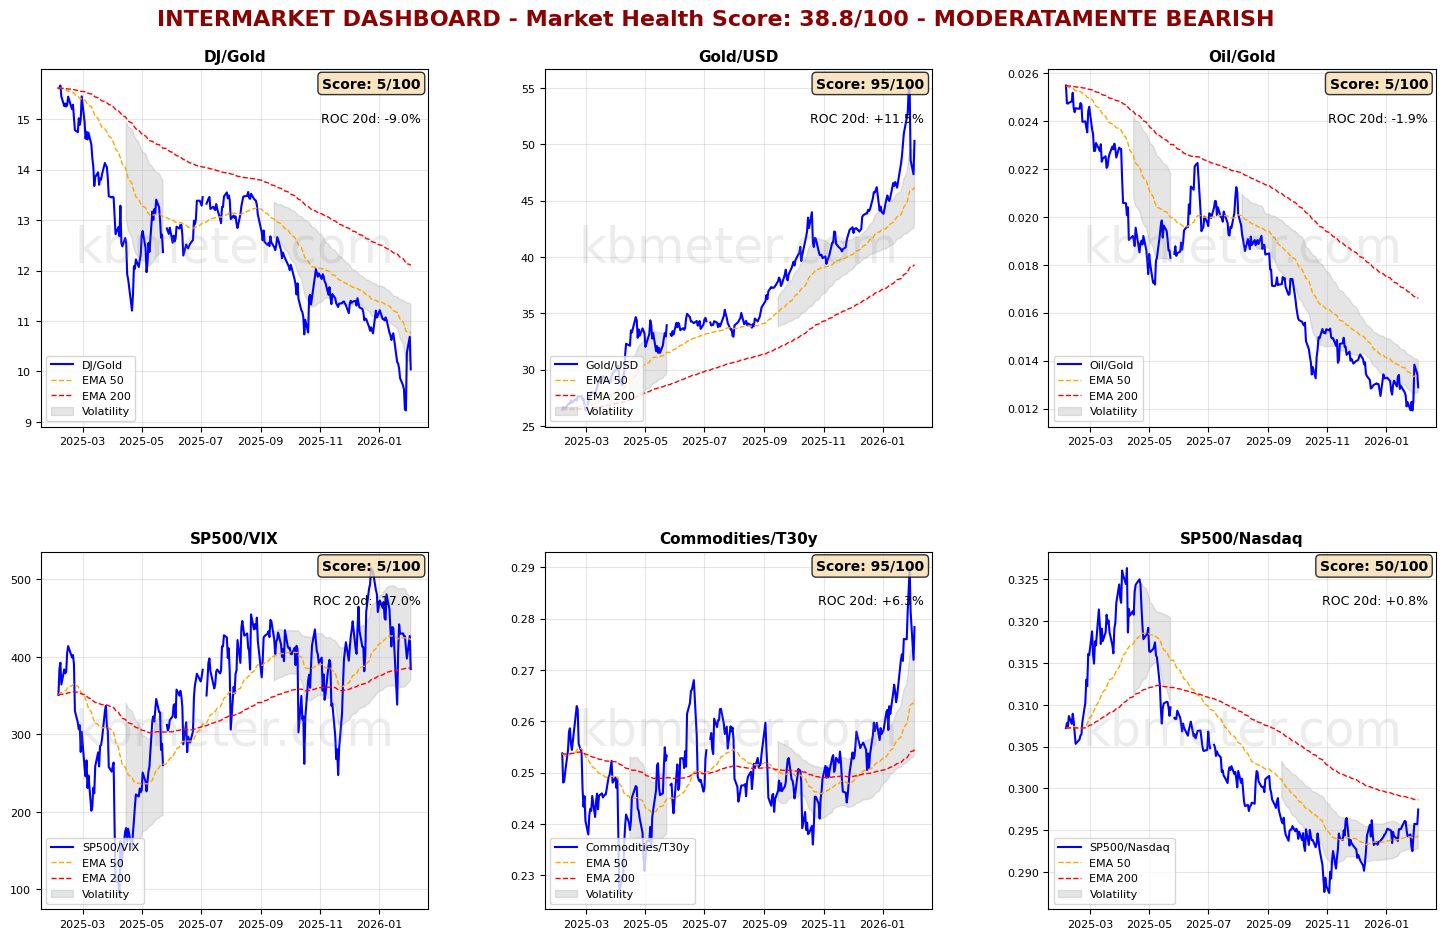
Financial markets today show a neutral to moderately negative sentiment. Intermarket analysis puts the Market Health Score at 39/100 (moderately negative). Our intermarket dashboards once again highlight a climate of pronounced uncertainty for investors. Risk indicators remain very weak and, in particular, a short-term trend shift appears to be emerging in the S&P 500/Nasdaq ratio, reflecting a sector rotation that is penalising the tech sector. On the asset allocation front, no major structural changes are evident, with short-term trends broadly confirmed.
Futures – Pre-Market: global futures signal a moderately risk-on tone (+0.13% on average), with the US slightly positive (+0.09%), Europe slightly negative (-0.11%) and Asia positive (+0.88%).
📊 Futures Globali – Sentiment Pre-Apertura
- CSI 300: +1.07%
- Hang Seng derived: +1.04%
- FTSE MIB derived: +0.90%
- IBEX 35 derived: -1.26%
- TecDAX derived: -0.96%
- Euro Stoxx 50 derived: -0.10%
📄 Detailed Intermarket Analysis
INTERMARKET ANALYSIS - 2026-02-04
============================================================

MARKET HEALTH SCORE: 38.8/100
SENTIMENT: MODERATELY BEARISH

============================================================
KEY RATIO SUMMARY
============================================================


DJ/Gold:
  - Component score: 5.0/100
  - Current value: 10.0416
  - Position vs EMA50: BELOW
  - 20-day ROC: -9.03%
  - 50-day ROC: -11.25%
  → Flight to safe havens

Gold/USD:
  - Component score: 95.0/100
  - Current value: 50.3253
  - Position vs EMA50: ABOVE
  - 20-day ROC: +11.46%
  - 50-day ROC: +23.70%

Oil/Gold:
  - Component score: 5.0/100
  - Current value: 0.0129
  - Position vs EMA50: BELOW
  - 20-day ROC: -1.93%
  - 50-day ROC: -11.57%
  → Energy demand weakening

SP500/VIX:
  - Component score: 5.0/100
  - Current value: 384.3228
  - Position vs EMA50: BELOW
  - 20-day ROC: -17.03%
  - 50-day ROC: +36.90%
  → Risk appetite contracting

Commodities/T30y:
  - Component score: 95.0/100
  - Current value: 0.2784
  - Position vs EMA50: ABOVE
  - 20-day ROC: +6.32%
  - 50-day ROC: +10.42%
  → Economic growth expectations

SP500/Nasdaq:
  - Component score: 50.0/100
  - Current value: 0.2975
  - Position vs EMA50: ABOVE
  - 20-day ROC: +0.83%
  - 50-day ROC: +1.06%
  - ⚠️ ANOMALY DETECTED – Significant deviation from the average

============================================================
CONCLUSIONS AND RECOMMENDATIONS
============================================================

The market is showing signs of weakness. Several ratios are in negative territory.
Risk appetite is declining. Increased caution is advised.
Positioning: DEFENSIVE, favoring safe havens.


STRONGEST RATIOS:
  • Gold/USD: 95.0/100
  • Commodities/T30y: 95.0/100
  • SP500/Nasdaq: 50.0/100

WEAKEST RATIOS:
  • DJ/Gold: 5.0/100
  • Oil/Gold: 5.0/100
  • SP500/VIX: 5.0/100

============================================================
Analysis automatically generated by kbmeter.com
Date: 2026-02-04
📄 Detailed Asset Allocation Analysis
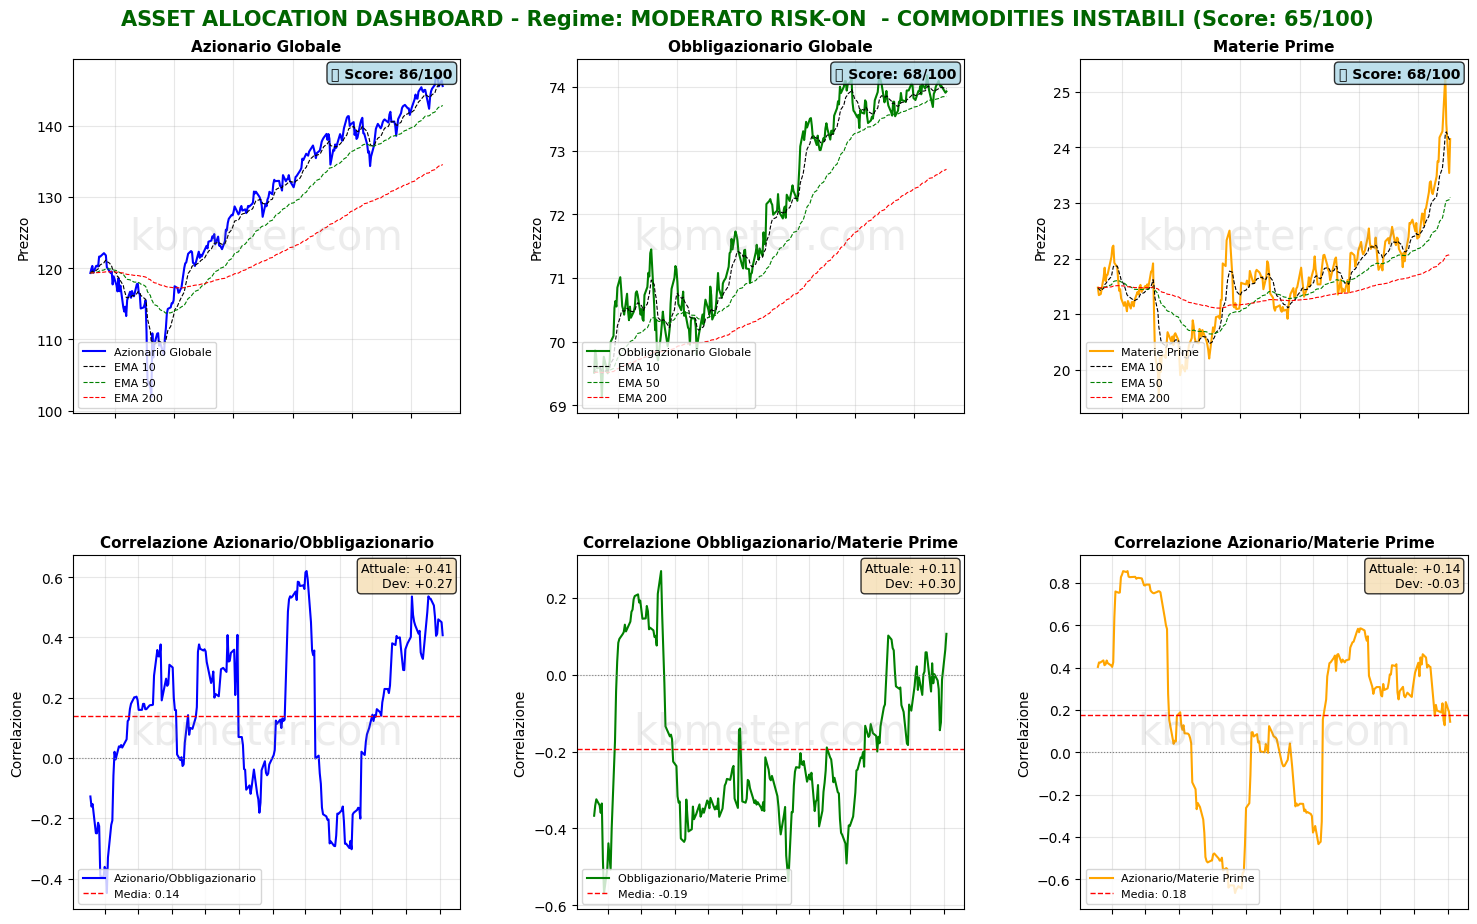
ASSET ALLOCATION & REGIME ANALYSIS - 2026-02-04
======================================================================

MARKET REGIME: MODERATE RISK-ON – COMMODITIES UNSTABLE
REGIME SCORE: 65.0/100

======================================================================
TREND AND VOLATILITY ANALYSIS
======================================================================

GLOBAL EQUITIES (ACWI):
  Short-Term Trend (5d): -0.89% | BELOW EMA 10
  Medium-Term Trend (20d): +0.82% | ABOVE EMA 50
  Long-Term Trend (60d): +5.37% | ABOVE EMA 200

  Volatility 5d: 8.2%
  Volatility 20d: 10.6%
  Volatility 60d: 11.1%

COMMODITIES (DBC):
  Medium-Term Trend (20d): +5.92% | ABOVE EMA 50
  Volatility 20d: 25.2%

ACWI/BND Correlation (30d): 0.407

REGIME INTERPRETATION:
The market shows a risk-on bias, albeit with elements of caution.
The overall trend remains constructive, but mixed signals may emerge
across certain time horizons.
Suggested positioning: BALANCED, with a slight tilt toward risk assets.

⚠️ COMMODITIES ALERT: Commodities are showing elevated volatility. This may
signal uncertainty around economic growth or unstable supply/demand dynamics.

======================================================================
ASSET RANKING – WHO IS PERFORMING BEST?
======================================================================

🥇 1. Global Equities (ACWI) - SCORE: 86/100
     Price: $145.54
     Trend: BELOW EMA10 | ABOVE EMA50 | ABOVE EMA200
     Performance: 5d -0.89% | 20d +0.82% | 60d +5.37%
     Volatility: 5d 8.2% | 20d 10.6% | 60d 11.1%
     Drawdown: -1.03%
     → Asset in STRONG HEALTH: positive trends with controlled volatility

🥈 2. Global Bonds (BND) - SCORE: 68/100
     Price: $73.93
     Trend: BELOW EMA10 | ABOVE EMA50 | ABOVE EMA200
     Performance: 5d -0.10% | 20d -0.01% | 60d +0.39%
     Volatility: 5d 0.8% | 20d 2.5% | 60d 2.7%
     Drawdown: -0.34%
     → Asset in FAIR CONDITION: predominantly positive signals

🥉 3. Commodities (DBC) - SCORE: 68/100
     Price: $24.15
     Trend: ABOVE EMA10 | ABOVE EMA50 | ABOVE EMA200
     Performance: 5d -3.17% | 20d +5.92% | 60d +9.25%
     Volatility: 5d 46.9% | 20d 25.2% | 60d 17.8%
     Drawdown: -4.55%
     → Asset in FAIR CONDITION: predominantly positive signals

======================================================================
CORRELATION ANALYSIS – CURRENT VS HISTORICAL
======================================================================

ACWI/BND:
  Current correlation (30d): +0.407
  Historical average (1y): +0.139
  Deviation: +0.268
  → Positive correlation: diversification IMPAIRED

BND/DBC:
  Current correlation (30d): +0.107
  Historical average (1y): -0.194
  Deviation: +0.301
  ⚠️ SIGNIFICANT DEVIATION from historical average

ACWI/DBC:
  Current correlation (30d): +0.144
  Historical average (1y): +0.178
  Deviation: -0.034

======================================================================
OPERATIONAL SUMMARY
======================================================================

STRONGEST ASSET: Global Equities (Score: 86/100)
WEAKEST ASSET: Commodities (Score: 68/100)

SUGGESTED ACTION: Favor the strongest asset while maintaining exposure to risk.
DIVERSIFICATION: EXCELLENT – Asset classes are moving independently.

======================================================================
Analysis automatically generated by kbmeter.com
Date: 2026-02-04
On the macro front, the day features the preliminary January 2026 inflation reading for the euro area, the final January PMI composite and services surveys, and the US ISM services index. From the US also come updates from the weekly ADP employment report, while markets await official jobs data, initially scheduled for Friday but currently postponed due to the shutdown.
On the earnings front, the spotlight today is on Alphabet, alongside results from Eli Lilly, Novartis, Uber, Qualcomm and UBS.
Already a subscriber? Login here
NOTES AND WARNINGS
Data compiled by kbmeter.com. Analysis date: 4 February 2026 - 7:44 AM GMT+1
This content is provided for informational purposes only and should not be considered financial advice. All scores and assessments are based on the previous trading day’s closing prices. Futures indications refer to the date and time of the analysis.
