
Tech Skepticism and Energy Crisis Rattle Markets; Risk-Off Flows Boost Treasuries
Skepticism toward the technology sector and the energy crisis. These are the two key factors that dominated the week, overshadowing even the positive signals coming from this week’s earnings reports. The risk-off signals we discussed yesterday have intensified, and our intermarket reports clearly reflect the impact of the unusual combination highlighted above.
US Treasuries are benefiting from this shift, while gold has yet to activate its traditional safe-haven mode and continues to suffer from high interest rates and a strong US dollar. Futures point to a negative opening for European markets and a weaker start for US equities.
Market Weather Map
October 23, 2026
US Equities
Eu Equities
Asia Equities
Commodities
Bonds
Dollar Index
Technology
Gold
Oil
Crypto
Market Summary
Do you want to see the score details for all assets monitored by KBMeter?
Try free for 14 days →Financial markets sentiment
Financial markets are currently showing a neutral to moderately negative sentiment. Intermarket analysis indicates a Market Health Score of 58/100.
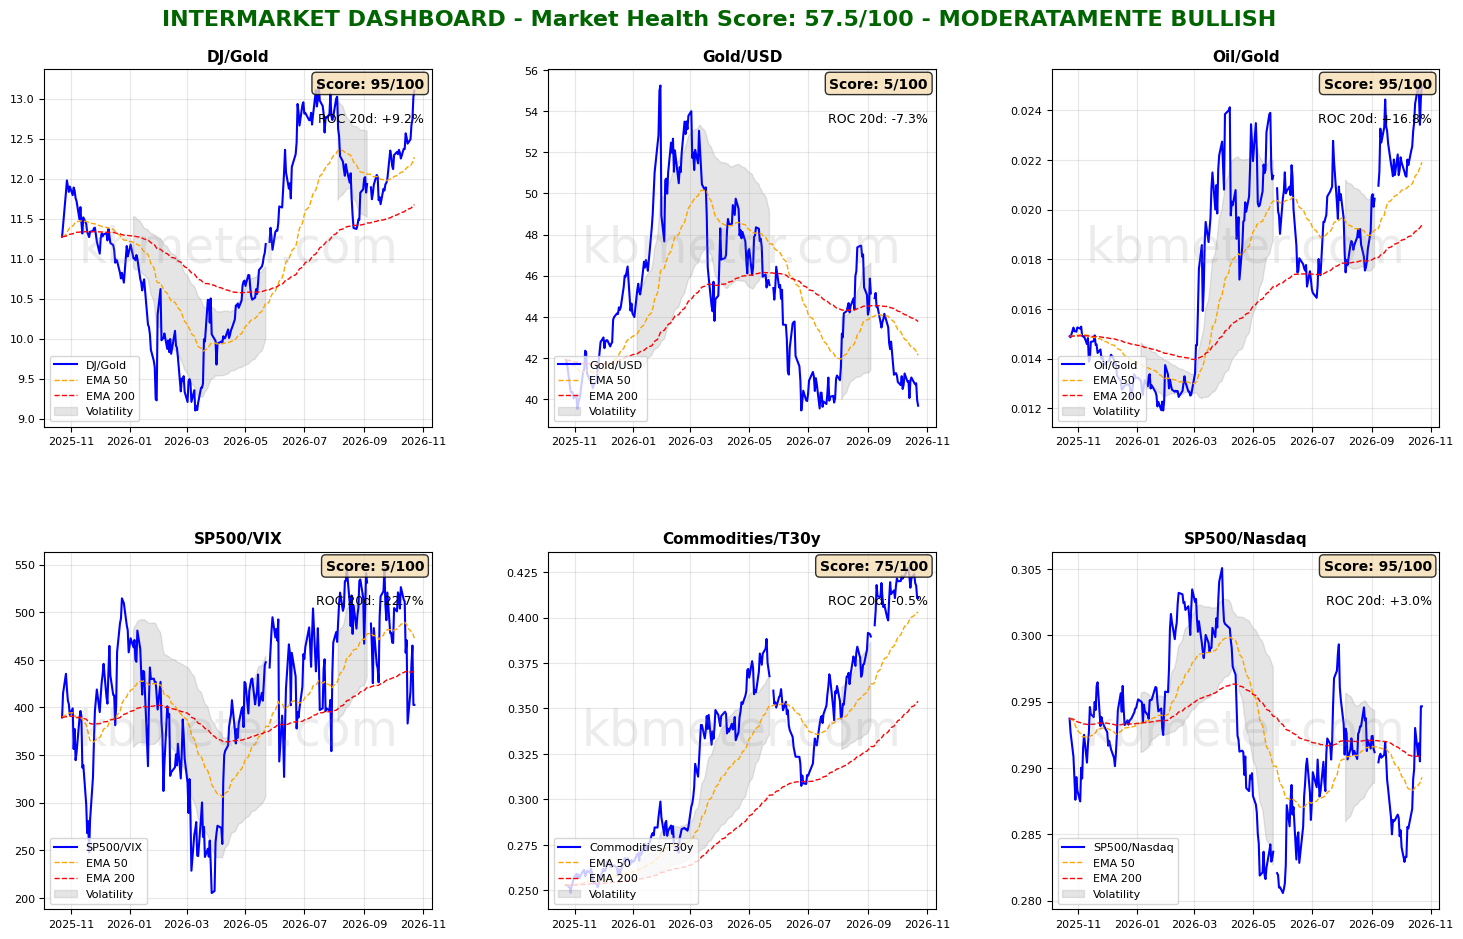
The week is drawing to a close with discouraging signals for both the technology sector and inflation. Our intermarket dashboards provide a clear picture of the current environment: the S&P 500/VIX ratio has fallen back below its long-term moving average, while the S&P 500/Nasdaq ratio has rebounded, as anticipated, reaching its highest level since last September.
The Dow Jones/Gold ratio further confirms the combination of technology sector weakness and inflation risk. Despite the absence of a genuine risk-on environment, the ratio has climbed to its highest level since last July. This can be explained, on the one hand, by the composition of the equity index, which has lower exposure to technology stocks, and, on the other, by gold’s weakness amid a strong US dollar and the prospect of further Fed rate hikes.
Risk-off signals, meanwhile, can be identified in the Commodities/Bonds ratio, as the denominator—represented by long-term US Treasuries—is recovering, driven by investors’ willingness to move toward safer assets.
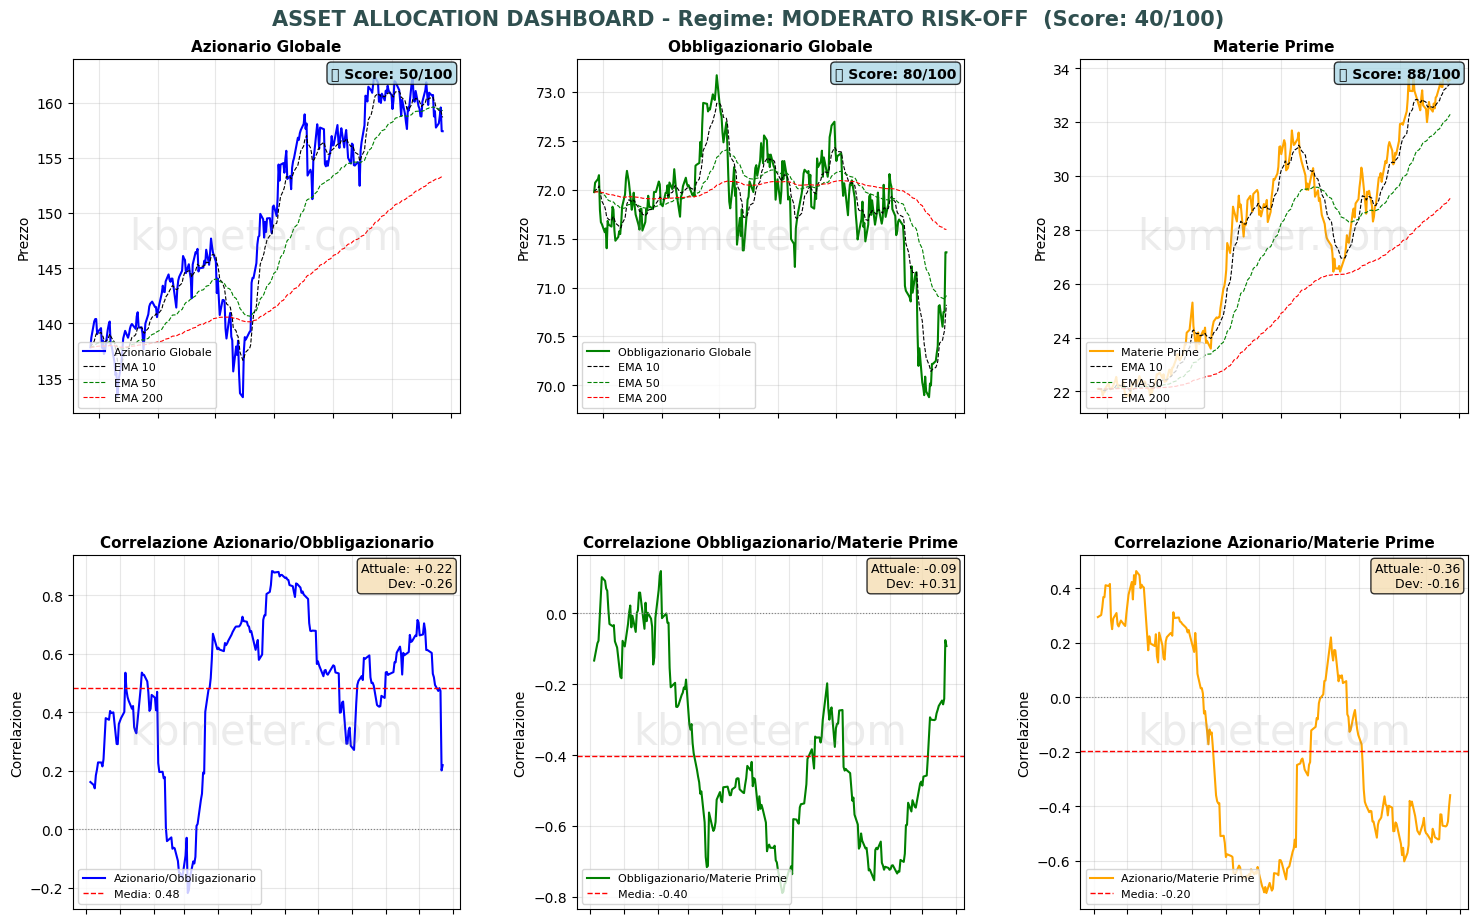
The asset class picture is particularly interesting. Global bonds have broken above their medium-term moving average, providing the first meaningful sign of recovery and reaching their highest level since the middle of last summer. Global equities remain range-bound but are ending the week in a critical support zone. Commodities continue to trend higher.
Our market weather map continues to indicate neutral conditions for equities. Gold has fallen back below 40 points, while bonds remain stable above the 50-point threshold.
Notably, the S&P 500, heavily influenced by large-cap technology stocks, has slipped to a score of 43 points—just 4 points above its annual low and down nearly 20 points over the past three months.
Looking at daily changes, 10-year US Treasuries gained 8 points, reaching the 60-point threshold for the first time since February 26, 2026.
Global Futures – Pre-Market Sentiment
Global futures point to a risk-off sentiment, with an average decline of 0.73%. US futures are slightly negative (-0.18%), European futures are down (-0.98%), and Asian futures are also in negative territory (-0.58%).
📊 Global Futures – Pre-Market Sentiment
- Nikkei 225: +0.06%
- US Tech 100: +0.01%
- Euro Stoxx 50: -0.07%
- FTSE MIB: -2.52%
- Taiwan: -1.81%
- IBEX 35: -1.81%
Macroeconomic calendar
Today’s macroeconomic calendar features the flash estimates of the October 2026 PMI surveys, Japanese inflation data for September 2026, and UK retail sales figures for September 2026.
On the corporate earnings front, results are expected today from American Express and Eni.
Assets to watch
Data as of Oct 22, 2026We have split the KBMeter scores into three bands, depending on their value: Weak, Intermediate or Strong. Here you can see which bands are most at risk of changing over the next 5 days and which ones hold.
The number on the right is the share of similar past cases in which the band had changed after 5 days. The higher it is, the more likely it is to change. The arrow in the current band appears when the asset is close to the border with the neighbouring band.
CONTINUE READING. ACTIVATE YOUR 14-DAY FREE TRIAL NOW. CLICK HERE
Already a subscriber? Login here
It does not say whether the price will rise or fall and it is not investment advice.
Already a subscriber? Login here
NOTES AND WARNINGS
Data compiled by kbmeter.com. Analysis date: 23 October 2026 - 8:49 AM GMT+1
This content is provided for informational purposes only and should not be considered financial advice. All scores and assessments are based on the previous trading day’s closing prices. Futures indications refer to the date and time of the analysis.