Markets Price in Trump’s Growing Urgency to End Iran War as Eurozone March Inflation Looms
Financial markets are bracing for another difficult day to interpret. On the Iran war front, Donald Trump’s impatience to bring the operation to an end is becoming increasingly evident, as it is proving politically costly for him. Investors are hopeful, though the outcome may look less reassuring over a longer horizon.
Attention is also focused on macroeconomic data, with the first inflation figures for the Eurozone in March and new data on the U.S. labor market. Sentiment remains between moderately negative and neutral, with continued high volatility and the majority of our Health Scores below the 50-point threshold. Futures indicate a positive opening for both Europe and the United States.
Market Weather Map
March 31, 2026
US Equities
Eu Equities
Asia Equities
Commodities
Bonds
Dollar Index
Technology
Gold
Oil
Crypto
Market Summary
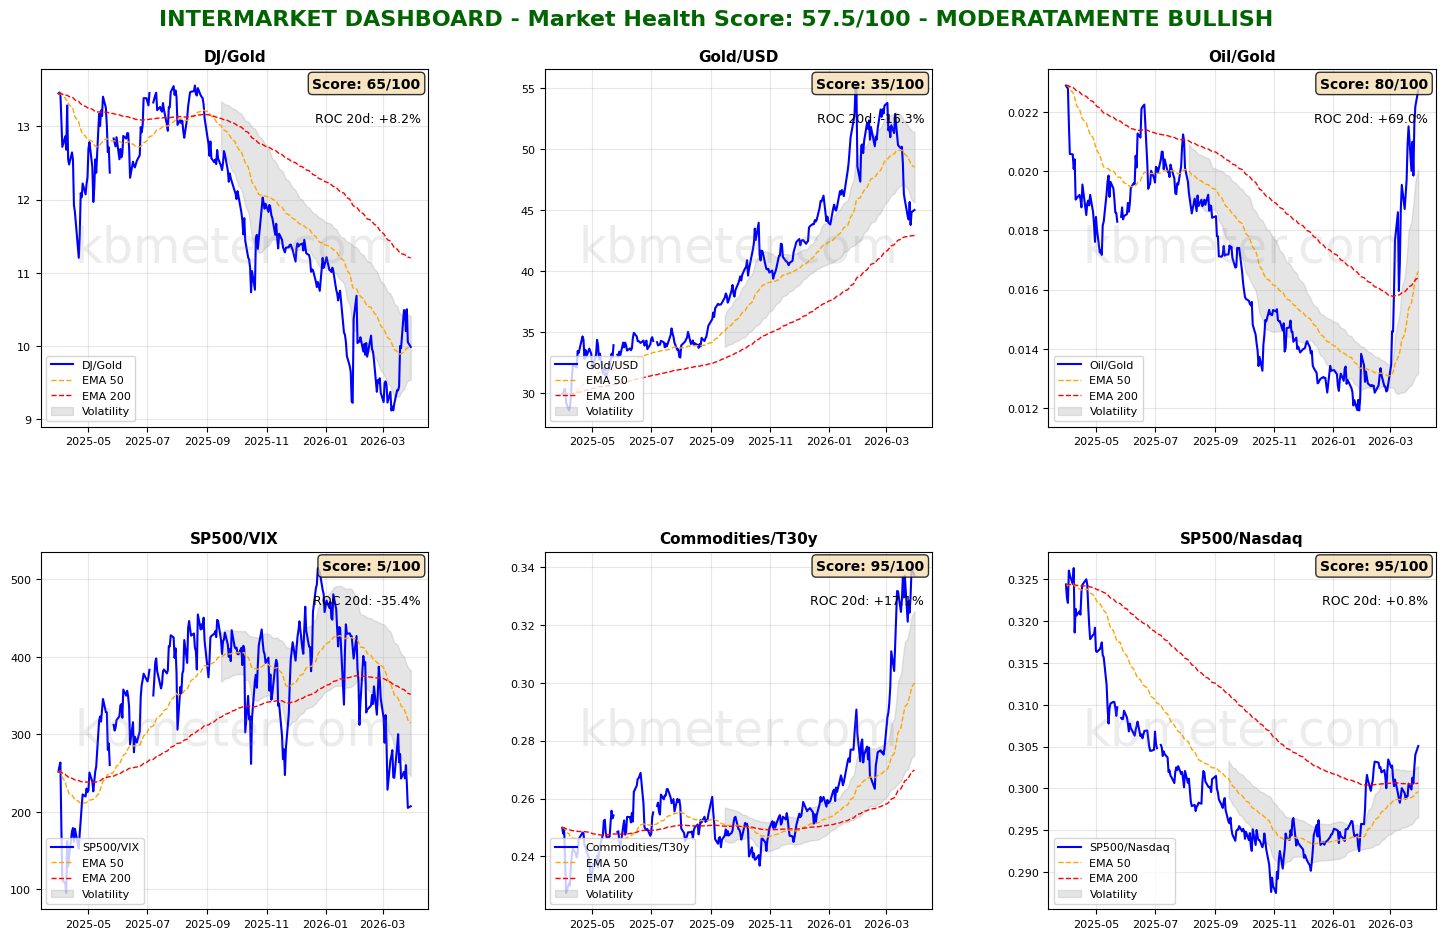
Financial markets today show a moderately negative sentiment. Intermarket analysis highlights a Market Health Score of 58/100 (neutral). In our intermarket dashboards, the situation remains delicate, with risk appetite indicators still very weak and oil and the dollar continuing to show strong momentum. Worth noting today is the performance of the S&P 500 to Nasdaq ratio, which is rising back to last summer’s levels, with the 50-day moving average getting closer and closer to the 200-day moving average.
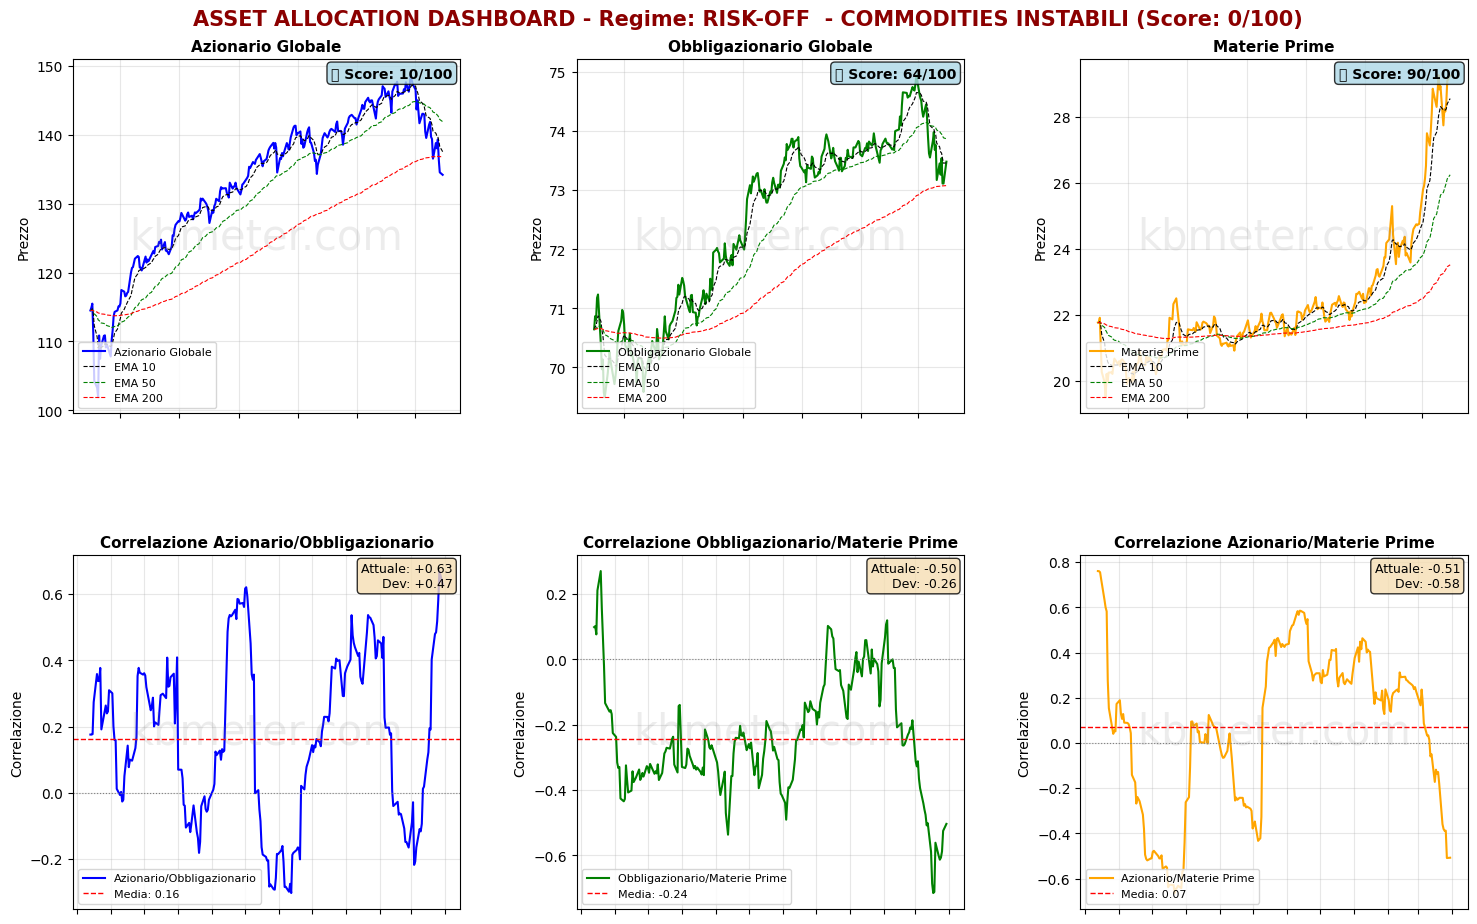
On the asset class front, the good news is that the support area around the 200-day moving average continues to hold, although with slightly more difficulty for global equities. This is an important signal, even if still too weak to provide clear indications about developments in the coming weeks. What is certain is that the correlation between equities and bonds remains positive, while commodities continue their upward trend, albeit with increased volatility.
Pre-Opening Futures: Global futures signal a moderate risk-on sentiment (+0.47% on average), with the U.S. positive (+0.85%), Europe slightly positive (+0.48%), and Asia slightly negative (-0.09%).
📊 Global Futures – Pre-Opening Sentiment
- Russell 2000: +1.27%
- FTSE MIB derived: +1.03%
- IBEX 35 derived: +0.96%
- Hang Seng derived: -0.40%
- CSI 300: -0.33%
- Mini MDAX derived: +0.00%
📄 Detailed Intermarket Analysis
INTERMARKET ANALYSIS - 2026-03-31
============================================================

MARKET HEALTH SCORE: 57.5/100
SENTIMENT: MODERATELY BULLISH

============================================================
MAIN RATIOS SUMMARY
============================================================


DJ/Gold:
  - Component score: 65.0/100
  - Current value: 9.9903
  - Position vs EMA50: ABOVE
  - 20-day ROC: +8.15%
  - 50-day ROC: -6.72%
  → Preference for risk assets vs safe haven

Gold/USD:
  - Component score: 35.0/100
  - Current value: 45.0303
  - Position vs EMA50: BELOW
  - 20-day ROC: -16.33%
  - 50-day ROC: -3.12%

Oil/Gold:
  - Component score: 80.0/100
  - Current value: 0.0227
  - Position vs EMA50: ABOVE
  - 20-day ROC: +68.95%
  - 50-day ROC: +77.28%
  - ⚠️ ANOMALY DETECTED - Significant deviation from the average
  → Rising energy demand

SP500/VIX:
  - Component score: 5.0/100
  - Current value: 207.2434
  - Position vs EMA50: BELOW
  - 20-day ROC: -35.43%
  - 50-day ROC: -52.73%
  → Contracting risk appetite

Commodities/T30y:
  - Component score: 95.0/100
  - Current value: 0.3372
  - Position vs EMA50: ABOVE
  - 20-day ROC: +17.06%
  - 50-day ROC: +27.43%
  → Economic growth expectations

SP500/Nasdaq:
  - Component score: 95.0/100
  - Current value: 0.3051
  - Position vs EMA50: ABOVE
  - 20-day ROC: +0.85%
  - 50-day ROC: +3.37%

============================================================
CONCLUSIONS AND RECOMMENDATIONS
============================================================

The market is moderately constructive. Some ratios show positive signals,
but elements of caution remain. Monitor developments closely.
Positioning: SELECTIVE, favor quality.


STRONGEST RATIOS:
  • Commodities/T30y: 95.0/100
  • SP500/Nasdaq: 95.0/100
  • Oil/Gold: 80.0/100

WEAKEST RATIOS:
  • DJ/Gold: 65.0/100
  • Gold/USD: 35.0/100
  • SP500/VIX: 5.0/100

============================================================
Analysis automatically generated by kbmeter.com
Date: 2026-03-31
📄 Detailed Asset Allocation Analysis
ASSET ALLOCATION & REGIME ANALYSIS - 2026-03-31
======================================================================

MARKET REGIME: RISK-OFF  - UNSTABLE COMMODITIES
REGIME SCORE: 0.0/100

======================================================================
TREND AND VOLATILITY ANALYSIS
======================================================================

GLOBAL EQUITIES (ACWI):
  Short-Term Trend (5d): -2.79% | BELOW EMA 10
  Medium-Term Trend (20d): -6.60% | BELOW EMA 50
  Long-Term Trend (60d): -5.82% | BELOW EMA 200

  Volatility 5d: 18.3%
  Volatility 20d: 18.9%
  Volatility 60d: 15.0%

COMMODITIES (DBC):
  Medium-Term Trend (20d): +12.93% | ABOVE EMA 50
  Volatility 20d: 28.4%

ACWI/BND Correlation (30d): 0.630

REGIME INTERPRETATION:
The market is in a risk-off regime. Negative trends across multiple horizons
and/or elevated volatility. Flight to safe assets.
Suggested positioning: DEFENSIVE, capital preservation.

⚠️ COMMODITIES ALERT: Commodities show elevated volatility. This may
indicate uncertainty around economic growth or unstable supply/demand dynamics.

======================================================================
ASSET RANKING - WHO IS OUTPERFORMING?
======================================================================

🥇 1. Commodities (DBC) - SCORE: 90/100
     Price: $29.26
     Trend: ABOVE EMA10 | ABOVE EMA50 | ABOVE EMA200
     Performance: 5d +3.61% | 20d +12.93% | 60d +30.68%
     Volatility: 5d 16.0% | 20d 28.4% | 60d 24.6%
     Drawdown: -0.03%
     → Asset in STRONG HEALTH: positive trends and controlled volatility

🥈 2. Global Bonds (BND) - SCORE: 64/100
     Price: $73.48
     Trend: ABOVE EMA10 | BELOW EMA50 | ABOVE EMA200
     Performance: 5d +0.30% | 20d -1.45% | 60d -0.12%
     Volatility: 5d 7.1% | 20d 5.7% | 60d 4.1%
     Drawdown: -1.95%
     → Asset in FAIR CONDITION: mostly positive signals

🥉 3. Global Equities (ACWI) - SCORE: 10/100
     Price: $134.19
     Trend: BELOW EMA10 | BELOW EMA50 | BELOW EMA200
     Performance: 5d -2.79% | 20d -6.60% | 60d -5.82%
     Volatility: 5d 18.3% | 20d 18.9% | 60d 15.0%
     Drawdown: -9.73%
     → Asset UNDER PRESSURE: avoid or significantly underweight

======================================================================
CORRELATION ANALYSIS - CURRENT vs HISTORICAL
======================================================================

ACWI/BND:
  Current correlation (30d): +0.630
  Historical average (1 year): +0.163
  Deviation: +0.467
  ⚠️ SIGNIFICANT DEVIATION from historical average
  → Positive correlation: diversification COMPROMISED

BND/DBC:
  Current correlation (30d): -0.504
  Historical average (1 year): -0.243
  Deviation: -0.261

ACWI/DBC:
  Current correlation (30d): -0.508
  Historical average (1 year): +0.068
  Deviation: -0.576
  ⚠️ SIGNIFICANT DEVIATION from historical average
  → Negative correlation: possible supply-driven shift

======================================================================
OPERATIONAL SUMMARY
======================================================================

STRONGEST ASSET: Commodities (Score: 90/100)
WEAKEST ASSET: Global Equities (Score: 10/100)

SUGGESTED ACTION: Reduce exposure to the weakest asset, favor defensive positioning.
DIVERSIFICATION: GOOD - diversification benefits present.

======================================================================
Analysis automatically generated by kbmeter.com
Date: 2026-03-31
On the macro front, the release of March inflation data continues today: Japan (Tokyo), France, and the Eurozone are in the spotlight, with expectations of a reacceleration in prices. Also noteworthy are China’s March PMI surveys, U.S. housing prices for February, retail sales and unemployment in Germany, U.S. job openings for February, U.S. consumer confidence from the Conference Board, and data on the performance of the Canadian economy at the beginning of 2026.
Already a subscriber? Login here
NOTES AND WARNINGS
Data compiled by kbmeter.com. Analysis date: 31 March 2026 - 7:42 AM GMT+1
This content is provided for informational purposes only and should not be considered financial advice. All scores and assessments are based on the previous trading day’s closing prices. Futures indications refer to the date and time of the analysis.