
Markets Open on Neutral Sentiment as Focus Shifts to Magnificent Seven Earnings
We left off with geopolitics and the technology sector driving financial markets, and we return to find the same key variables at play, albeit in a far more dynamic environment. Renewed tensions in the Middle East have reignited the energy sector, pushing the Oil/Gold ratio back to the levels seen at the beginning of the summer. Meanwhile, the technology sector is awaiting the first quarterly earnings reports from the Magnificent Seven, with the S&P 500/Nasdaq ratio approaching a key resistance area after rebounding from last week’s AI-driven sell-off. Overall, equities remain in neutral territory, as does investor sentiment, while volatility has started to rise again. Futures point to a broadly flat opening for U.S. markets and a slightly weaker start for Europe.
Market Weather Map
July 20, 2026
US Equities
Eu Equities
Asia Equities
Commodities
Bonds
Dollar Index
Technology
Gold
Oil
Crypto
Market Summary
Do you want to see the score details for all assets monitored by KBMeter?
Try free for 14 days →Financial markets sentiment
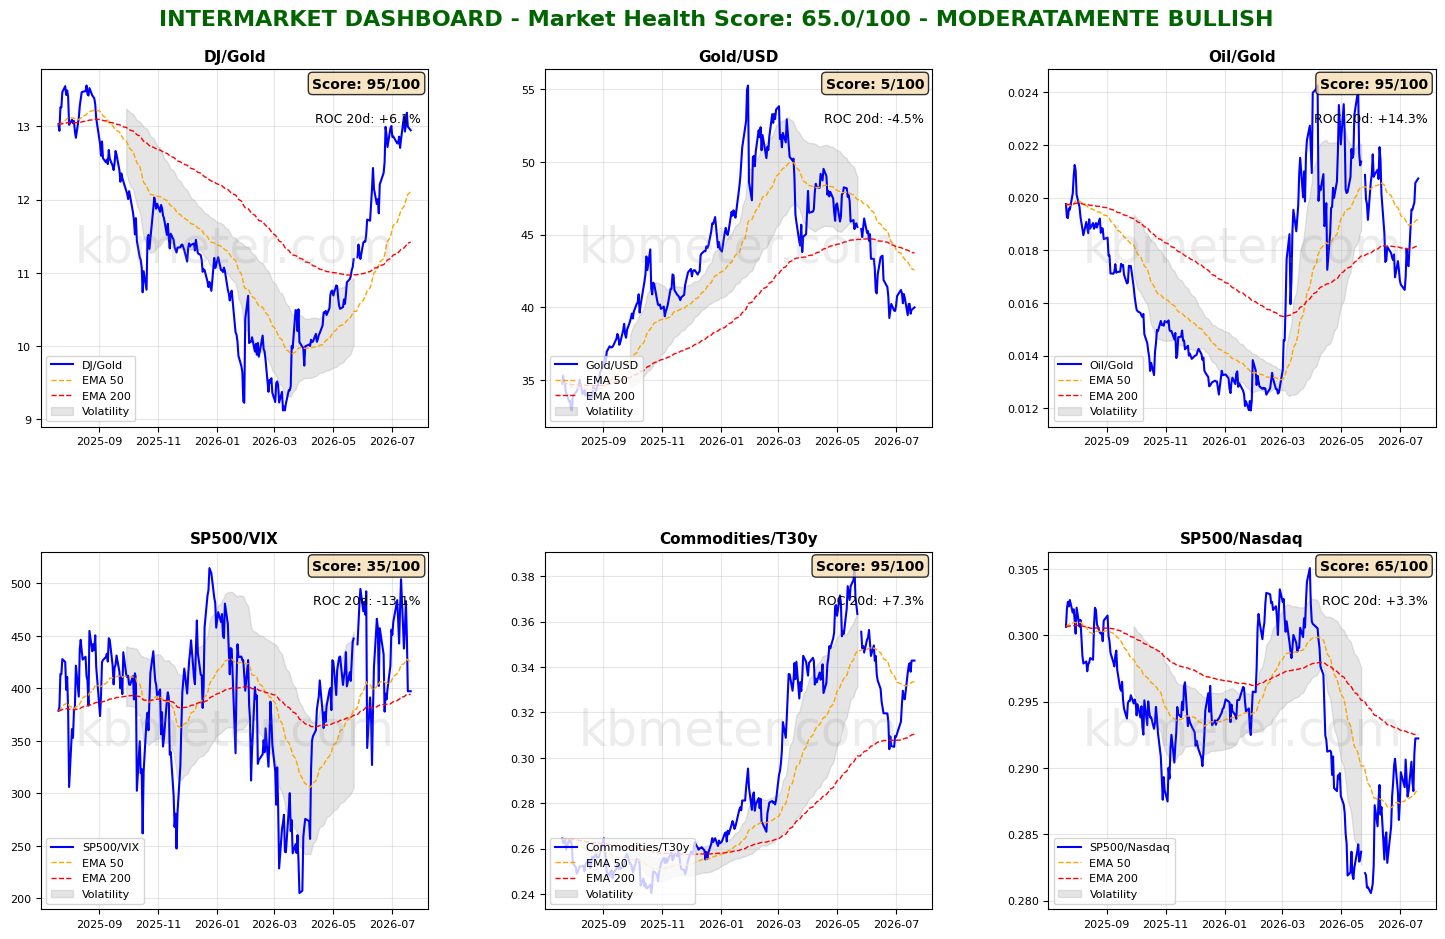
Financial markets currently display a neutral sentiment. Intermarket analysis shows a Market Health Score of 65/100, indicating a mildly positive backdrop.
Just over a week after our last analysis, the intermarket dashboards appear to have shifted back several months. Technology and geopolitics remain the dominant market drivers, and this is clearly reflected in the intermarket ratios.
Starting with the Oil/Gold ratio, it has climbed back above both its long-term and medium-term moving averages. At the same time, the Commodities/Bonds ratio has completed its rebound from the long-term moving average, returning to the levels recorded at the end of last May. Ongoing tensions in the Middle East continue to support elevated inflation expectations and keep the prospect of a less accommodative monetary policy firmly on the table.
The U.S. dollar has regained some strength against gold, with the USD/Gold ratio confirming the bearish crossover between the 50-day and the 200-day moving averages. The other key variable remains the technology sector. Here, the performance of the S&P 500/Nasdaq ratio is particularly noteworthy: after rebounding from its yearly lows, the ratio first recovered above the 50-day moving average before approaching the major resistance represented by the long-term moving average. Whether this resistance holds will depend, perhaps above all, on the corporate earnings reports that begin to be released this week.
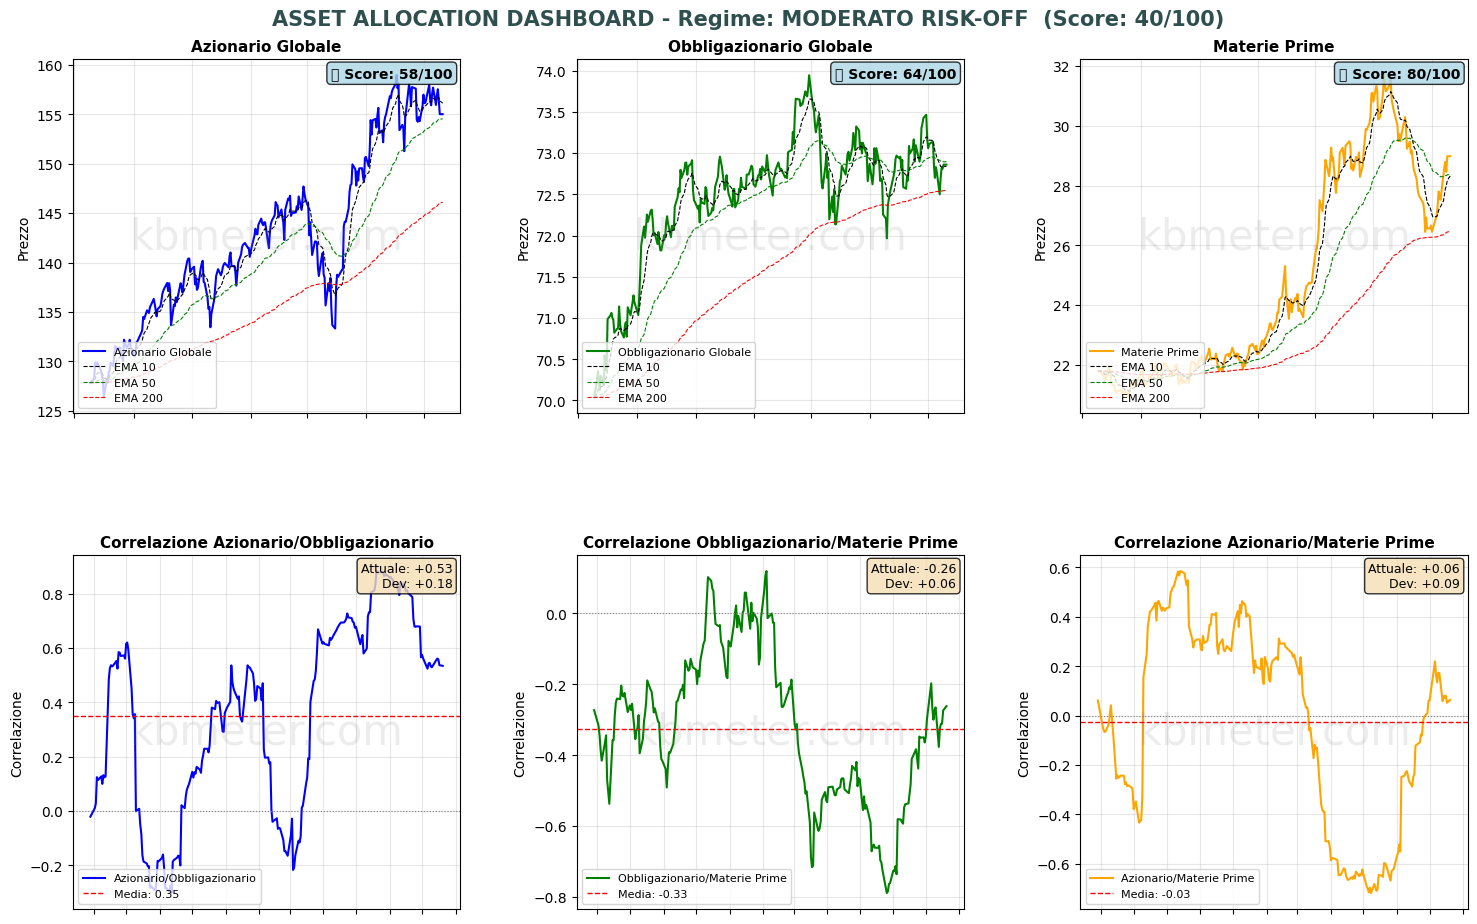
Across the major asset classes, the transition from a short-term bullish trend to a sideways pattern continues for both bonds and equities. By contrast, the renewed strength in the energy sector has boosted commodities, which have moved back above their medium-term moving average after rebounding from the support provided by the long-term moving average.
Our Market Weather Map continues to highlight the neutral environment that has developed in equities, while the U.S. technology sector remains below the 50-point threshold. Looking at weekly score changes reveals several notable developments. The VIX has surged by nearly 20 points, reflecting a renewed sense of market anxiety, while WTI crude oil has gained 18 points. At the same time, recent U.S. inflation data have eased pressure on short-term bond yields, although inflation concerns remain evident in longer-dated maturities and inflation-linked securities.
Global Futures – Pre-Market Sentiment
Pre-Market Futures: Global equity futures point to a moderately risk-off tone, with an average decline of 0.07%. U.S. futures are marginally positive (+0.01%), European futures are slightly negative (-0.05%), and Asian markets are modestly lower (-0.23%).
📊 Global Futures – Pre-Market Sentiment
- Hang Seng derived: +1.90%
- US Tech 100 derived: +0.53%
- CAC 40 derived: +0.47%
- CSI 300: -2.91%
- FTSE MIB derived: -0.98%
- Dow Jones 30 cv1: -0.78%
Macroeconomic calendar
The macroeconomic calendar—particularly eventful this week—begins with the People’s Bank of China’s decision to leave its Prime Loan Rates unchanged, followed by the release of Canada’s June 2026 inflation figures.
Already a subscriber? Login here
NOTES AND WARNINGS
Data compiled by kbmeter.com. Analysis date: 20 July 2026 - 7:34 AM GMT+1
This content is provided for informational purposes only and should not be considered financial advice. All scores and assessments are based on the previous trading day’s closing prices. Futures indications refer to the date and time of the analysis.
