Markets Hope for Iran War End, Await US Data: ADP, Retail Sales, ISM
Financial markets are attempting to confirm the cautious optimism that emerged toward the end of March, currently supported only by the numerous statements from Trump regarding the imminent — according to the U.S. president — end of the war in Iran.
Market sentiment remains uncertain, and volatility continues to stay at elevated levels. Investors are now awaiting macroeconomic data to begin assessing the broader economic impact of the crisis. The focus starts with ADP labor market data and U.S. retail sales for February. Futures indicate a positive opening for both Europe and the United States.
Market Weather Map
April 1, 2026
US Equities
Eu Equities
Asia Equities
Commodities
Bonds
Dollar Index
Technology
Gold
Oil
Crypto
Market Summary
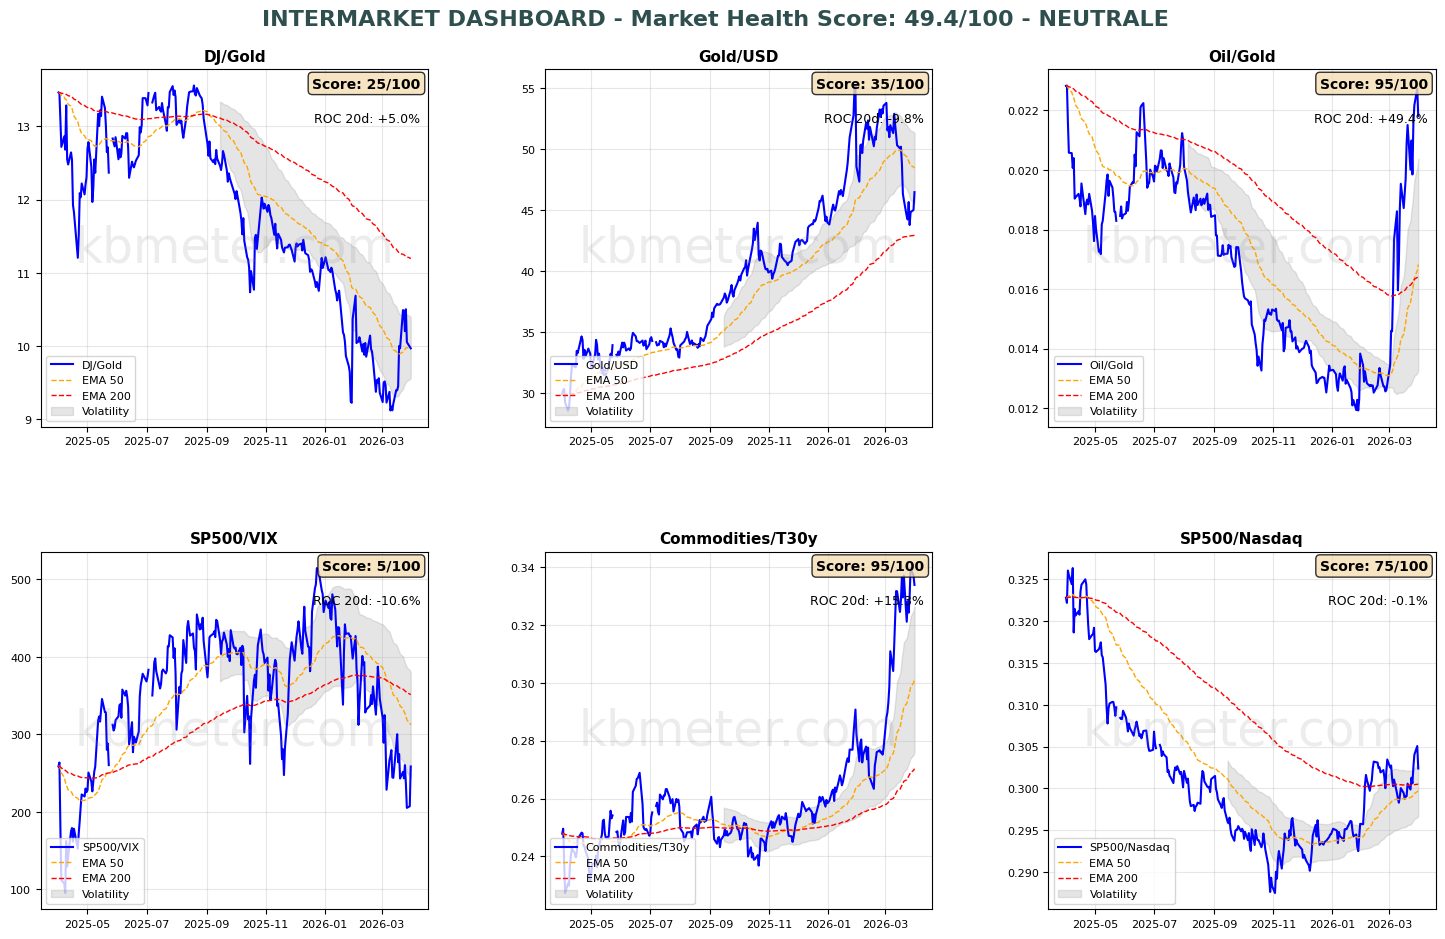
Overall, financial markets are showing a neutral sentiment today. Intermarket analysis highlights a Market Health Score of 49/100 (neutral).
Our intermarket dashboards show tentative signs of improvement in risk appetite indicators, although the overall situation remains stable. Asset class analysis also confirms the trends observed in recent days: to breathe a sigh of relief, markets will need to move away from their long-term moving averages, both for equities and global bonds.
Pre-Market Futures: Global futures point to a risk-on sentiment (average +0.81%), with the U.S. slightly positive (+0.24%), Europe strongly positive (+1.26%), and Asia slightly positive (+0.20%).
📊 Global Futures – Pre-Market Sentiment
- FTSE MIB derived: +2.53%
- IBEX 35 derived: +2.05%
- DAX derived: +1.80%
- CSI 300: -0.64%
- Mini MDAX derived: +0.00%
- FTSE 100 derived: +0.08%
📄 Detailed Intermarket Analysis
INTERMARKET ANALYSIS - 2026-04-01
============================================================

MARKET HEALTH SCORE: 49.4/100
SENTIMENT: NEUTRAL

============================================================
MAIN RATIOS SUMMARY
============================================================


DJ/Gold:
  - Component score: 25.0/100
  - Current value: 9.9711
  - Position vs EMA50: BELOW
  - 20-day ROC: +5.00%
  - 50-day ROC: -7.31%
  → Flight to safe haven

Gold/USD:
  - Component score: 35.0/100
  - Current value: 46.4946
  - Position vs EMA50: BELOW
  - 20-day ROC: -9.83%
  - 50-day ROC: +0.71%

Oil/Gold:
  - Component score: 95.0/100
  - Current value: 0.0218
  - Position vs EMA50: ABOVE
  - 20-day ROC: +49.42%
  - 50-day ROC: +68.39%
  → Rising energy demand

SP500/VIX:
  - Component score: 5.0/100
  - Current value: 258.5552
  - Position vs EMA50: BELOW
  - 20-day ROC: -10.60%
  - 50-day ROC: -40.91%
  → Declining risk appetite

Commodities/T30y:
  - Component score: 95.0/100
  - Current value: 0.3339
  - Position vs EMA50: ABOVE
  - 20-day ROC: +15.26%
  - 50-day ROC: +25.70%
  → Economic growth expectations

SP500/Nasdaq:
  - Component score: 75.0/100
  - Current value: 0.3024
  - Position vs EMA50: ABOVE
  - 20-day ROC: -0.12%
  - 50-day ROC: +2.46%

============================================================
CONCLUSIONS AND RECOMMENDATIONS
============================================================

The market is in a neutral/sideways phase. Mixed signals across the various ratios.
There is no clear directional bias. Wait for confirmation.
Positioning: BALANCED, avoid excess risk.


STRONGEST RATIOS:
  • Oil/Gold: 95.0/100
  • Commodities/T30y: 95.0/100
  • SP500/Nasdaq: 75.0/100

WEAKEST RATIOS:
  • Gold/USD: 35.0/100
  • DJ/Gold: 25.0/100
  • SP500/VIX: 5.0/100

============================================================
Analysis automatically generated by kbmeter.com
Date: 2026-04-01
📄 Detailed Asset Allocation Analysis
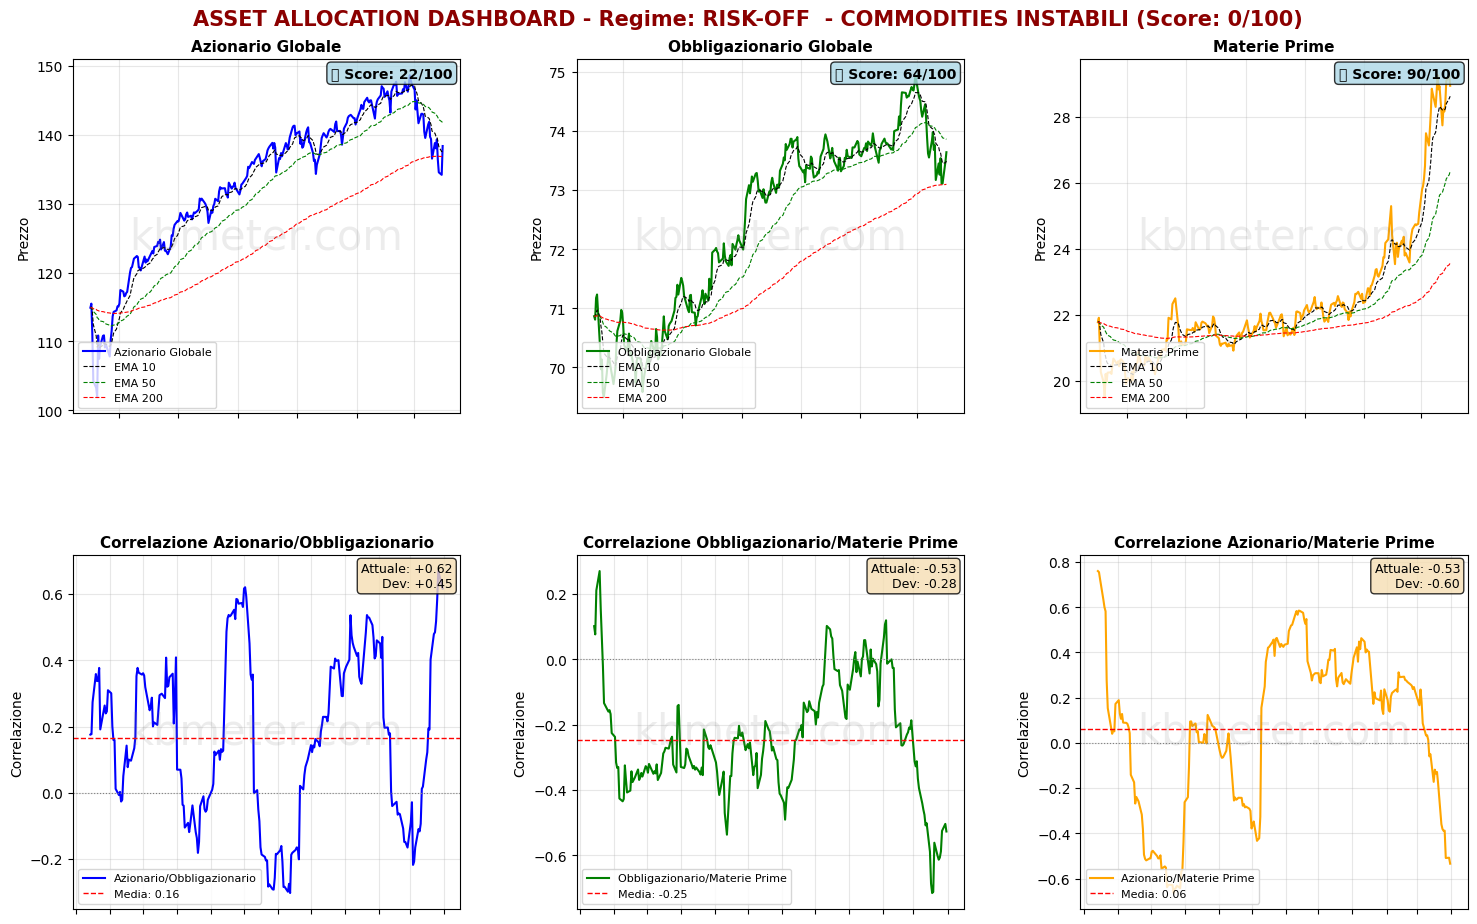
ASSET ALLOCATION & REGIME ANALYSIS - 2026-04-01
======================================================================

MARKET REGIME: RISK-OFF - UNSTABLE COMMODITIES
REGIME SCORE: 0.0/100

======================================================================
TREND AND VOLATILITY ANALYSIS
======================================================================

GLOBAL EQUITIES (ACWI):
  Short-Term Trend (5d): -0.70% | ABOVE EMA 10
  Medium-Term Trend (20d): -4.57% | BELOW EMA 50
  Long-Term Trend (60d): -3.70% | ABOVE EMA 200

  Volatility 5d: 32.7%
  Volatility 20d: 21.8%
  Volatility 60d: 16.3%

COMMODITIES (DBC):
  Medium-Term Trend (20d): +10.75% | ABOVE EMA 50
  Volatility 20d: 29.0%

ACWI/BND Correlation (30d): 0.616

REGIME INTERPRETATION:
The market is in a risk-off regime. Negative trends across multiple timeframes and/or elevated volatility.
Flight to safe assets.
Suggested positioning: DEFENSIVE, capital preservation.

⚠️ COMMODITIES ALERT: Commodities are showing elevated volatility. This may
indicate uncertainty around economic growth or unstable supply/demand dynamics.

======================================================================
ASSET RANKING - WHO IS PERFORMING BEST?
======================================================================

🥇 1. Commodities (DBC) - SCORE: 90/100
     Price: $28.95
     Trend: ABOVE EMA10 | ABOVE EMA50 | ABOVE EMA200
     Performance: 5d +2.77% | 20d +10.75% | 60d +26.92%
     Volatility: 5d 20.3% | 20d 29.0% | 60d 24.8%
     Drawdown: -1.09%
     → Asset in STRONG HEALTH: positive trends and controlled volatility

🥈 2. Global Bonds (BND) - SCORE: 64/100
     Price: $73.64
     Trend: ABOVE EMA10 | BELOW EMA50 | ABOVE EMA200
     Performance: 5d +0.14% | 20d -1.17% | 60d -0.10%
     Volatility: 5d 6.8% | 20d 5.8% | 60d 4.1%
     Drawdown: -1.74%
     → Asset in DECENT condition: mostly positive signals

🥉 3. Global Equities (ACWI) - SCORE: 22/100
     Price: $138.37
     Trend: ABOVE EMA10 | BELOW EMA50 | ABOVE EMA200
     Performance: 5d -0.70% | 20d -4.57% | 60d -3.70%
     Volatility: 5d 32.7% | 20d 21.8% | 60d 16.3%
     Drawdown: -6.92%
     → Asset UNDER PRESSURE: avoid or significantly underweight

======================================================================
CORRELATION ANALYSIS - CURRENT vs HISTORICAL
======================================================================

ACWI/BND:
  Current correlation (30d): +0.616
  Historical average (1 year): +0.165
  Deviation: +0.451
  ⚠️ SIGNIFICANT DEVIATION from historical average
  → Positive correlation: diversification COMPROMISED

BND/DBC:
  Current correlation (30d): -0.527
  Historical average (1 year): -0.246
  Deviation: -0.281

ACWI/DBC:
  Current correlation (30d): -0.535
  Historical average (1 year): +0.062
  Deviation: -0.597
  ⚠️ SIGNIFICANT DEVIATION from historical average
  → Negative correlation: possible supply-driven shift

======================================================================
OPERATIONAL SUMMARY
======================================================================

STRONGEST ASSET: Commodities (Score: 90/100)
WEAKEST ASSET: Global Equities (Score: 22/100)

SUGGESTED ACTION: Reduce exposure to the weakest asset, favor defensive positioning.
DIVERSIFICATION: GOOD - diversification benefits present.

======================================================================
Analysis automatically generated by kbmeter.com
Date: 2026-04-01
On the macro front, today’s agenda includes final manufacturing PMI data, ADP U.S. labor market data, U.S. retail sales for February 2026, and the March ISM manufacturing index.
Already a subscriber? Login here
NOTES AND WARNINGS
Data compiled by kbmeter.com. Analysis date: 1 April 2026 - 7:28 AM GMT+1
This content is provided for informational purposes only and should not be considered financial advice. All scores and assessments are based on the previous trading day’s closing prices. Futures indications refer to the date and time of the analysis.