
Markets Enter Final Quarter in Neutral Territory as Mixed Data, Oil Hopes and AI Shape Equity Outlook
Financial markets are leaving behind a rather gloomy September and welcoming the final quarter of the year with mixed signals, fueling the ongoing dual narrative across equities and bonds. Yesterday’s US macroeconomic data provided reassurance on both inflation and the resilience of consumer spending, while on this side of the Atlantic, consumer prices climbed to their highest level in three years. On the energy crisis front, the deadlock between the US and Iran persists, although oil flows through the Strait of Hormuz are recovering to pre-crisis levels. Finally, the figures released yesterday by Micron confirm the optimism surrounding the technology sector, which remains firmly at the helm of the equity market. Overall, sentiment remains in neutral territory, while futures point to a negative opening for Europe and a positive one for the United States.
Market Weather Map
October 1, 2026
US Equities
Eu Equities
Asia Equities
Commodities
Bonds
Dollar Index
Technology
Gold
Oil
Crypto
Market Summary
Do you want to see the score details for all assets monitored by KBMeter?
Try free for 14 days →Financial markets sentiment
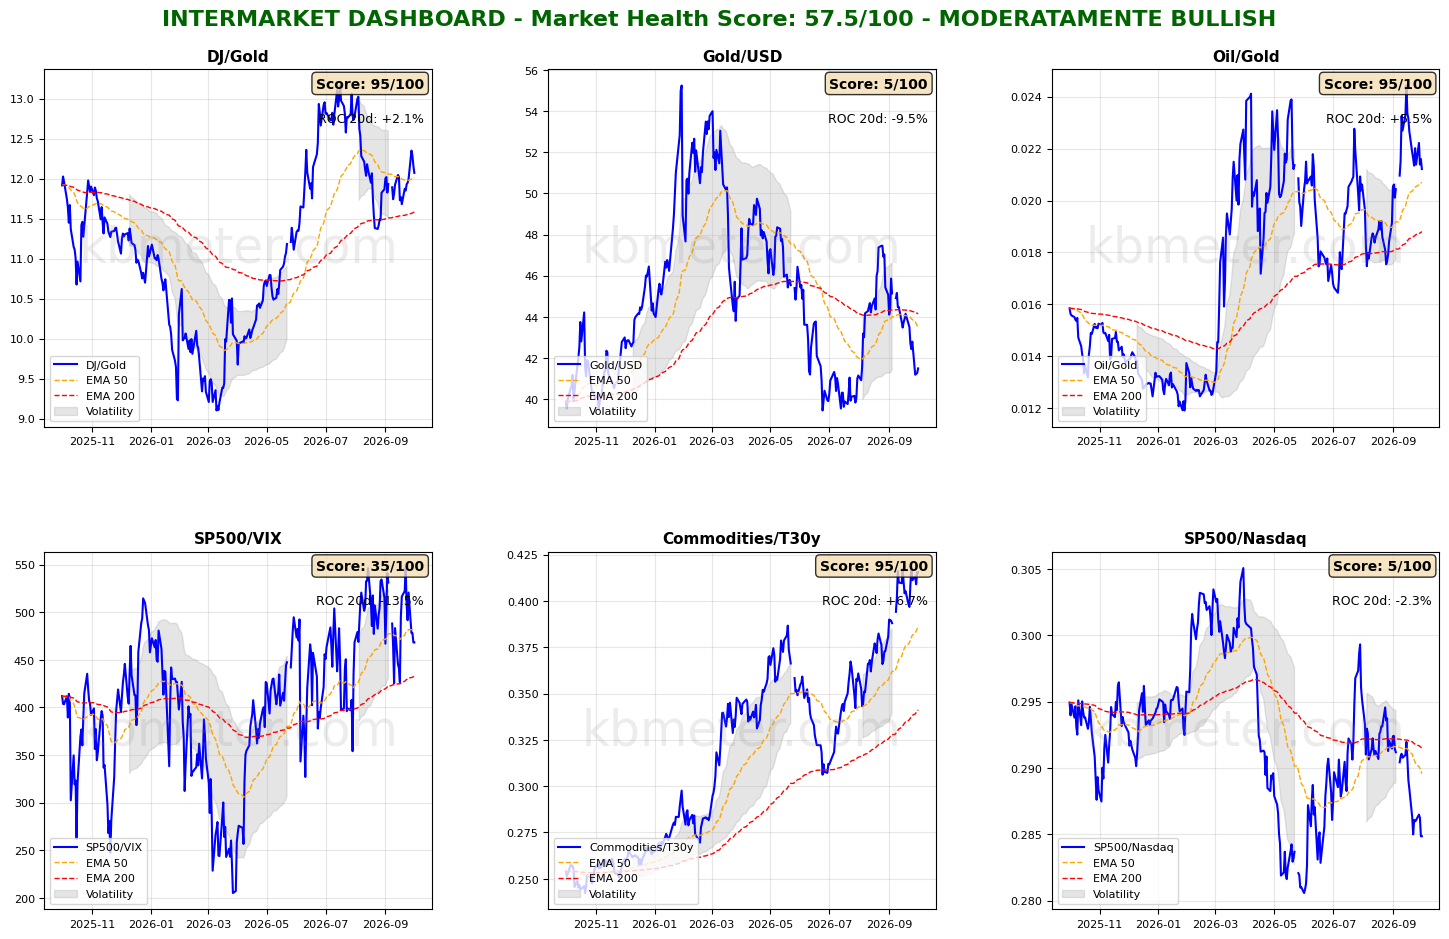
Financial markets are showing neutral sentiment today. Intermarket analysis points to a Market Health Score of 58/100. Three intermarket ratios effectively summarize the situation across financial markets at the beginning of the final quarter of 2026, highlighting two parallel narratives.
The Commodities/Bonds ratio continues to hover near its period highs, confirming persistent pressure on bond yields and upward momentum in the energy sector. The S&P 500/VIX ratio remains below its medium-term moving average, accompanied by pronounced volatility. The S&P 500/Nasdaq ratio is accelerating to the downside, reaching its lowest level since the end of June 2026.
In summary, sentiment remains in neutral territory; equities are staying afloat, supported by the strength of the technology sector, while expectations for higher interest rates and inflation remain elevated. Two seemingly irreconcilable narratives.
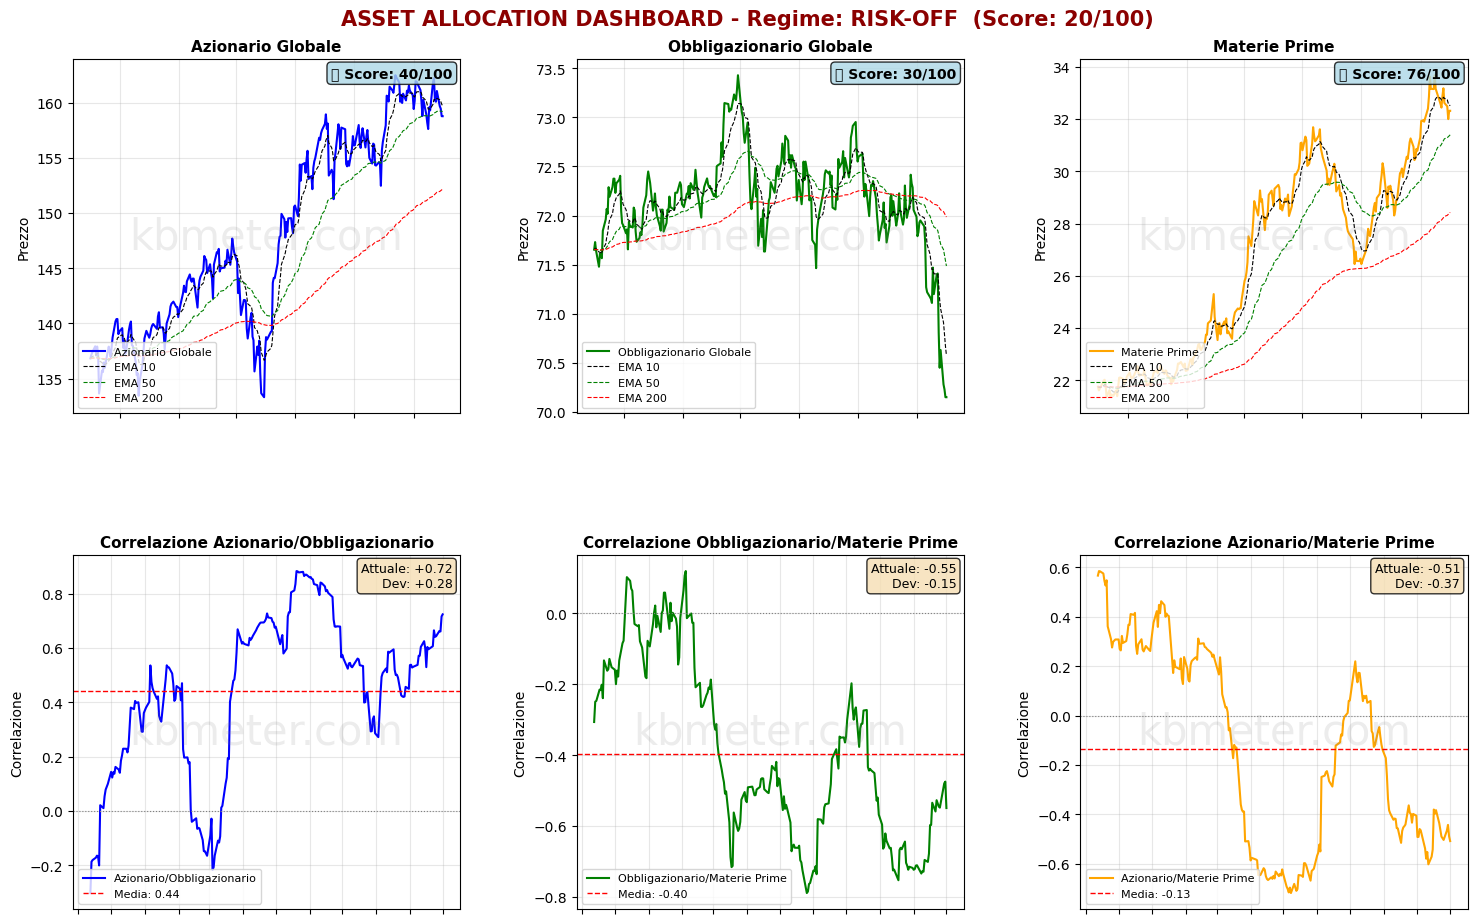
Taking a broader look at the major asset classes, the situation appears closer to normal: equities are not advancing but are hovering around their medium-term moving average. Bonds continue their sharp decline. Commodities appear to have reached a peak and seem likely to remain there for some time.
Our market weather map provides an even clearer picture: equities remain in neutral territory, with the US technology sector scoring more than 10 points above the overall equity market average (46). Bonds and gold remain in negative territory, while, on the other side of the equation, the US dollar remains in positive territory. Commodities as a whole remain neutral, weighed down by precious metals: there is a gap of almost 20 points in the score between energy and precious metals.
Global Futures – Pre-Market Sentiment
Pre-Market Futures: Global futures point to a moderately risk-on sentiment (+0.14% on average), with the US positive (+0.58%), Europe negative (-0.58%), and Asia strongly positive (+1.07%).
📊 Global Futures – Pre-Market Sentiment
- Nikkei 225: +2.73%
- US Tech 100: +0.93%
- US 500: +0.56%
- FTSE MIB: -1.30%
- Euro Stoxx 50: -0.57%
- DAX: -0.50%
Macroeconomic calendar
It is a somewhat quieter day in terms of macroeconomic data. The final September PMI survey readings are due, along with August unemployment figures for the Euro area, the September ISM Manufacturing update, and the latest US jobless claims data.
Already a subscriber? Login here
NOTES AND WARNINGS
Data compiled by kbmeter.com. Analysis date: 1 October 2026 - 8:32 AM GMT+1
This content is provided for informational purposes only and should not be considered financial advice. All scores and assessments are based on the previous trading day’s closing prices. Futures indications refer to the date and time of the analysis.