
Markets End the Week on Edge: Tech and Gold Remain Under Pressure as US Small Caps Shine
The week is drawing to a close with the same concerns that marked its opening. Earnings reports from the major technology companies have done little to brighten the outlook. On the contrary, weaker-than-expected figures from Alphabet and concerns surrounding Intel have weighed on the technology sector. Investors, however, do not appear willing to abandon US equities, as demonstrated by the performance of Small Caps and the resilience of the Dow. Global bonds are approaching a test of their long-term moving average, while gold remains weak. Today, the spotlight is firmly on the Eurozone, with October inflation figures and the preliminary estimate of third-quarter economic growth due for release (with France already delivering a negative surprise). Futures point to a flat opening in Europe and a weaker start for US markets.
Market Weather Map
October 30, 2026
US Equities
Eu Equities
Asia Equities
Commodities
Bonds
Dollar Index
Technology
Gold
Oil
Crypto
Market Summary
Do you want to see the score details for all assets monitored by KBMeter?
Try free for 14 days →Financial markets sentiment
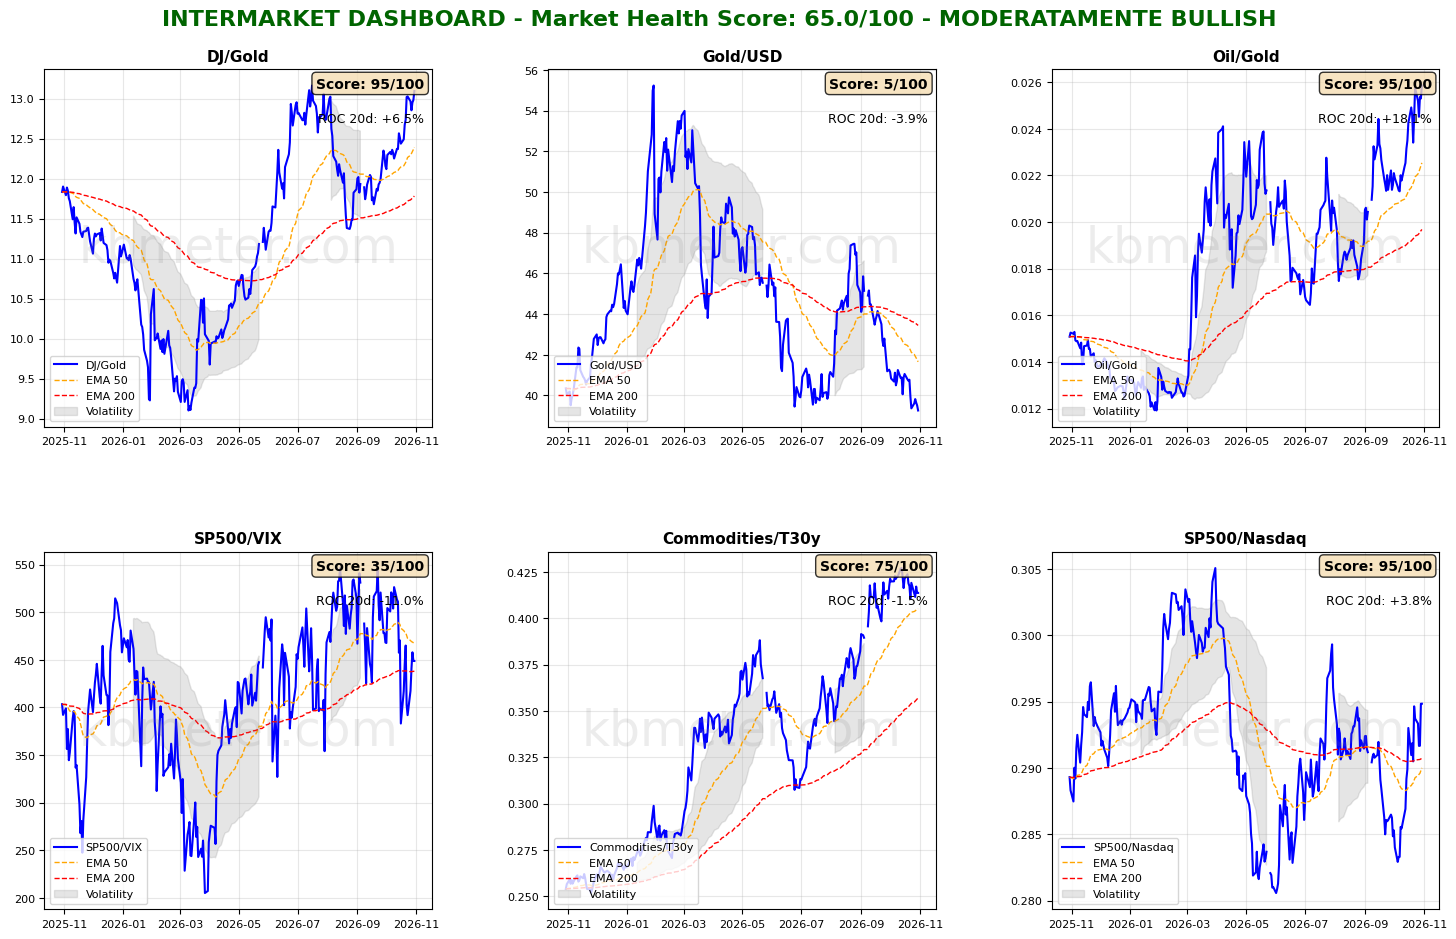
Financial markets are currently showing a neutral sentiment. Intermarket analysis indicates a Market Health Score of 65/100. Our intermarket dashboards end the week continuing to signal a cautious stance among investors, with some indicators becoming increasingly pronounced. The S&P 500/VIX ratio remains around its long-term moving average, while the S&P 500/Nasdaq ratio is rebounding from the long-term moving average area, forming two higher lows and confirming the ongoing difficulties facing the technology sector. The Dow/Gold ratio remains near the highs of the period, although this signal reflects not so much a renewed risk-on environment as pronounced weakness in gold. The precious metal continues to be weighed down by inflation and interest rate expectations, while its safe-haven appeal has yet to come into play. Oil remains strong, as does the US dollar, with the corresponding ratios showing both assets trading near the upper end of their respective ranges. Long-dated US Treasuries continue their short-term recovery, with the Commodities/Bonds ratio returning to levels last seen at the end of September.
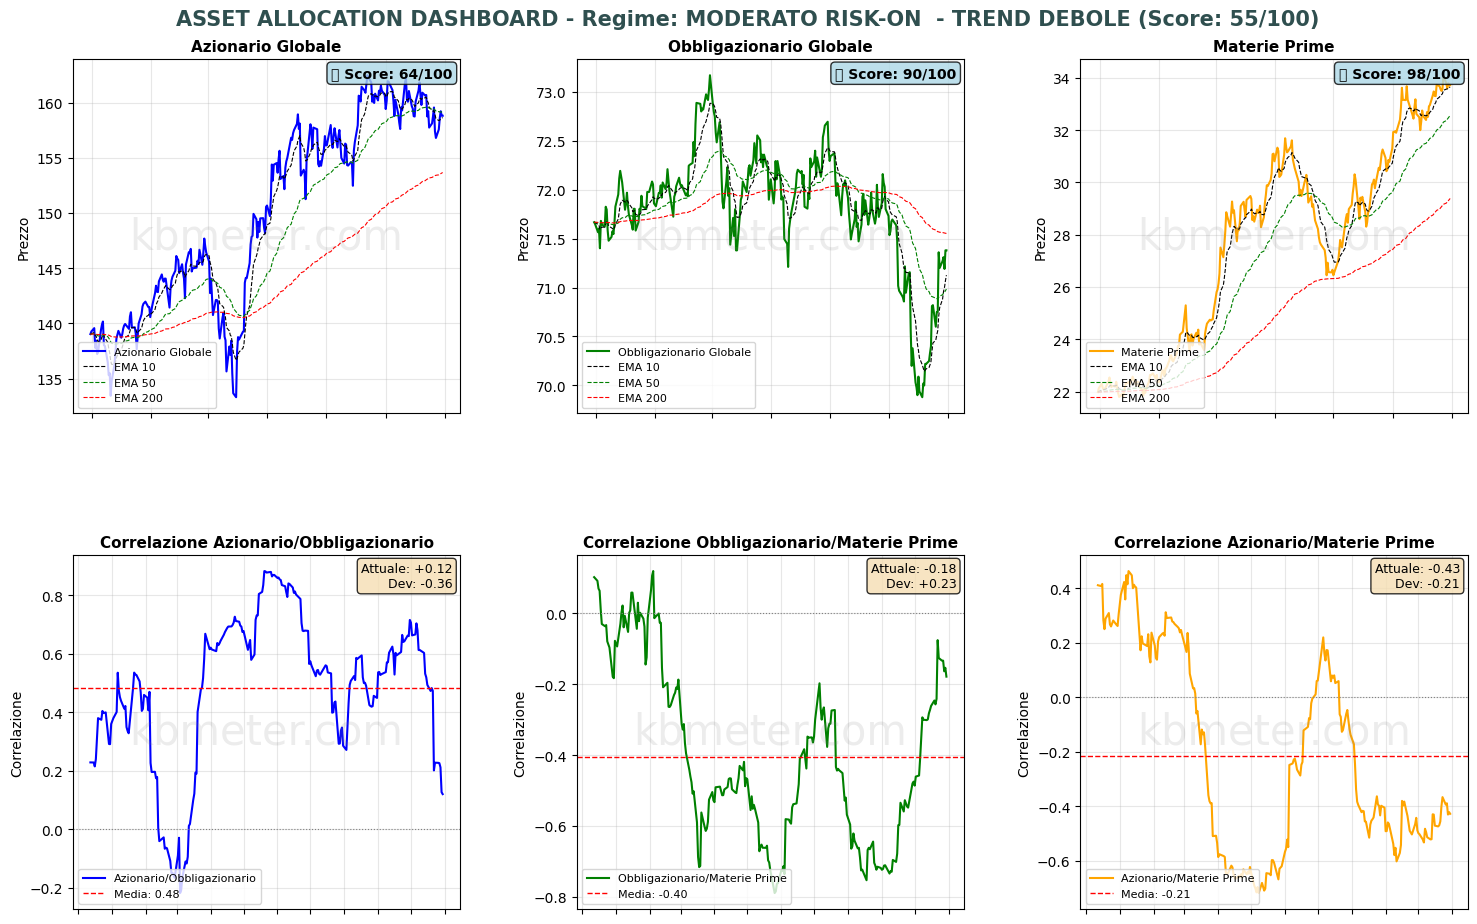
Turning to asset classes, we continue to view global equities as trading within a sideways range, while global bonds are approaching the most important test of this phase: resistance represented by the long-term moving average. It is also worth noting that the correlation between equities and bonds has declined further, moving closer to zero.
Our market weather map continues to indicate a neutral outlook for equities, with more fragile conditions in the technology sector and Asia. Gold remains in the weakness zone, while the US dollar and oil continue to dominate. Looking at weekly changes, US Small Caps stand out. Their seven-day score has increased by 17 points, including a seven-point gain yesterday alone. The Health Score is now above 70, reaching a five-year high and coming close to the all-time high for the entire series. This is a significant signal: investors are not selling the United States; they are selling technology. European equity markets also enjoyed a recovery over the week, particularly in France and Italy, which gained 14 score points over seven days.
Global Futures – Pre-Market Sentiment
Pre-Market Futures: Global futures point to a moderately risk-off sentiment (-0.45% on average), with US futures down (-0.82%), European futures slightly higher (+0.20%) and Asian futures marginally lower (-0.43%).
📊 Global Futures – Pre-Market Sentiment
- CAC 40: +1.24%
- Hang Seng: +1.13%
- FTSE MIB: +0.26%
Macroeconomic calendar
On the macroeconomic front, today’s agenda includes updated October macroeconomic data from Japan and the Bank of Japan’s policy decision. In the Eurozone, markets are awaiting the preliminary October 2026 inflation figures and the first estimate of third-quarter 2026 economic growth. In the United States, the focus will be on third-quarter employment cost data.
As for corporate earnings, today brings results from ExxonMobil and Chevron. Investors will also be watching the earnings figures from Banca Intesa.
Assets to watch
Data as of Oct 29, 2026We have split the KBMeter scores into three bands, depending on their value: Weak, Intermediate or Strong. Here you can see which bands are most at risk of changing over the next 5 days and which ones hold.
The number on the right is the share of similar past cases in which the band had changed after 5 days. The higher it is, the more likely it is to change. The arrow in the current band appears when the asset is close to the border with the neighbouring band.
CONTINUE READING. ACTIVATE YOUR 14-DAY FREE TRIAL NOW. CLICK HERE
Already a subscriber? Login here
It does not say whether the price will rise or fall and it is not investment advice.
Already a subscriber? Login here
NOTES AND WARNINGS
Data compiled by kbmeter.com. Analysis date: 30 October 2026 - 8:11 AM GMT+1
This content is provided for informational purposes only and should not be considered financial advice. All scores and assessments are based on the previous trading day’s closing prices. Futures indications refer to the date and time of the analysis.