Markets Edge Higher on IEA Oil Plan, Trump Comments and Oracle Earnings; Focus on U.S. Inflation
Financial markets are attempting to regain some confidence and are preparing to analyze the U.S. inflation data for February. Statements by Trump about the imminent end of the war in Iran, the IEA’s plan to release oil onto the market, and positive news from Oracle’s quarterly earnings have helped bring sentiment back toward neutral territory.
Volatility remains very high and risk-appetite indicators are still quite uncertain. Futures point to a positive opening for both Europe and the United States. Financial markets today show a neutral to slightly negative sentiment.
Market Weather Map
March 11, 2026
US Equities
Eu Equities
Asia Equities
Commodities
Bonds
Dollar Index
Technology
Gold
Oil
Crypto
Market Summary
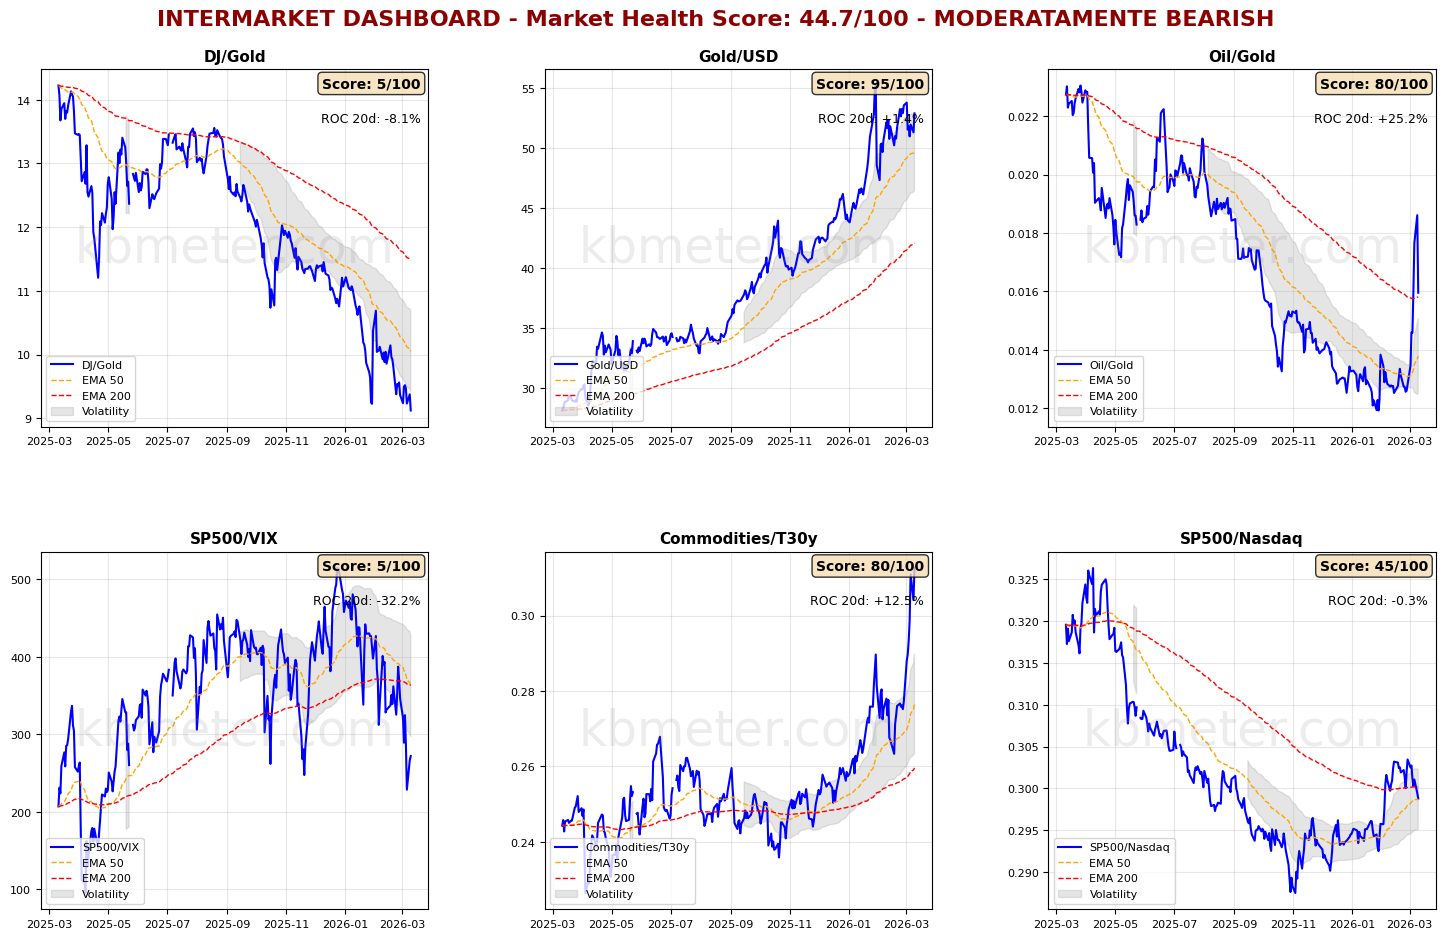
Intermarket analysis highlights a Market Health Score of 45/100 (moderately negative). Our intermarket dashboards signal a slight improvement in sentiment conditions. In particular, a recovery appears to be underway in the technology sector, although it remains to be seen whether this will prove sustainable.
The S&P 500/Nasdaq ratio has fallen back below its 50-day moving average for the first time since last January. The tech sector shows a health score of 53, placing it in neutral territory. The Oil/Gold ratio is pulling back, although it remains above its long-term moving average.
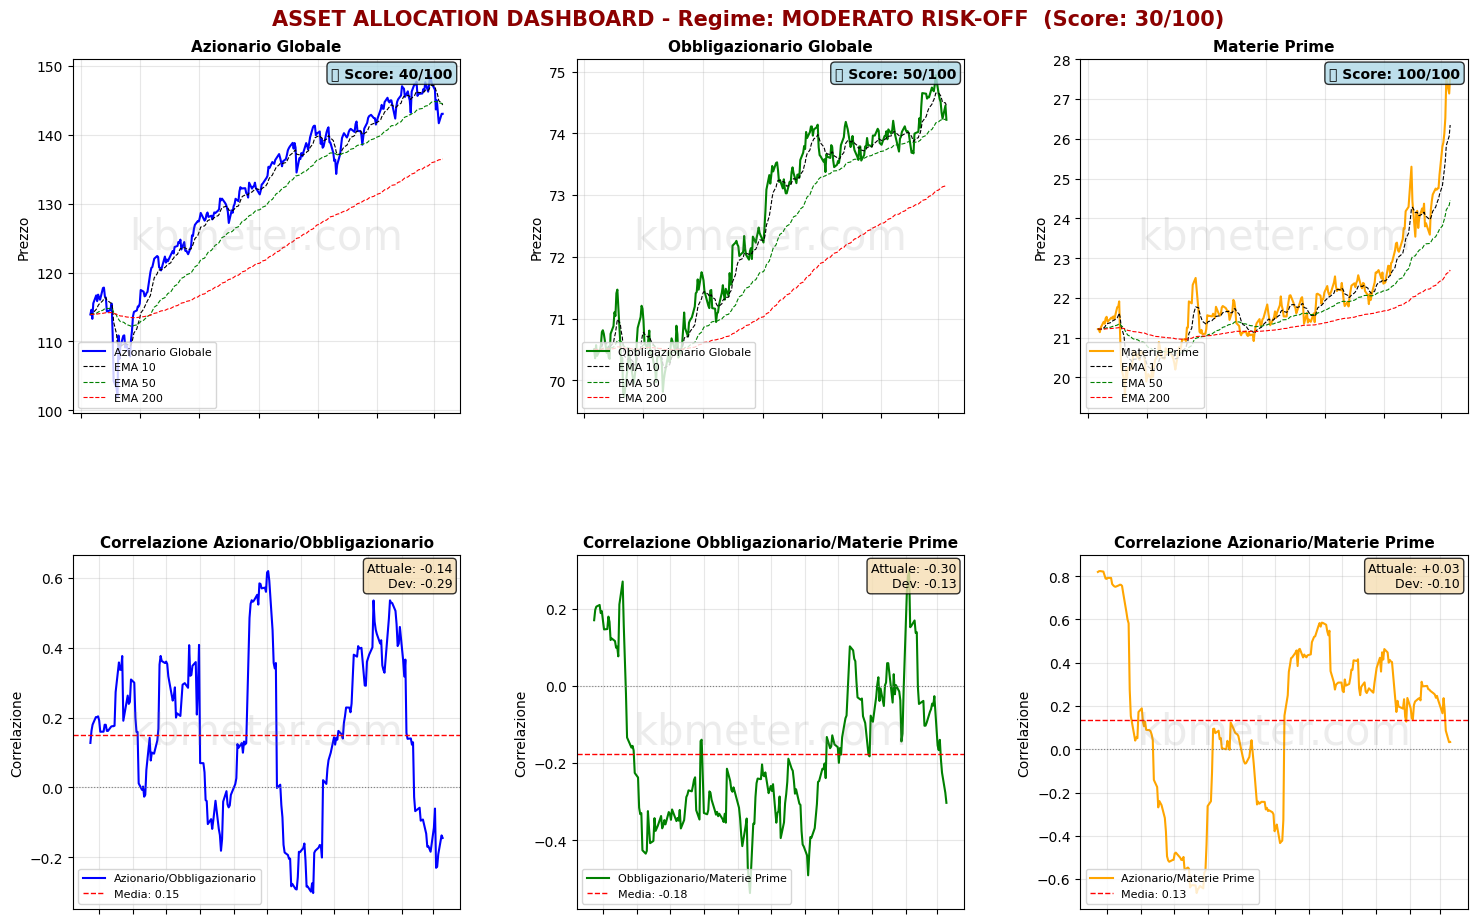
Regarding the major asset classes, the weak phase continues for both global equities and bonds. Equities remain below their medium-term moving average, while bonds continue to test the support provided by their medium-term moving average.
Pre-Market Futures: Global futures indicate a risk-on sentiment (average +0.63%), with the U.S. slightly positive (+0.28%), Europe positive (+0.82%), and Asia positive (+0.55%).
📊 Global Futures – Pre-Opening Sentiment
- FTSE MIB derived: +2.67%
- IBEX 35 derived: +2.39%
- TecDAX derived: +2.05%
- Hang Seng derived: -0.30%
- DAX derived: -0.19%
- Euro Stoxx 50 derived: -0.12%
📄 Detailed Intermarket Analysis
INTERMARKET ANALYSIS - 2026-03-11
============================================================

MARKET HEALTH SCORE: 44.7/100
SENTIMENT: MODERATELY BEARISH

============================================================
SUMMARY OF MAIN RATIOS
============================================================


DJ/Gold:
  - Component score: 5.0/100
  - Current value: 9.1222
  - Position vs EMA50: BELOW
  - ROC 20 days: -8.10%
  - ROC 50 days: -16.13%
  → Flight to safe haven

Gold/USD:
  - Component score: 95.0/100
  - Current value: 52.9161
  - Position vs EMA50: ABOVE
  - ROC 20 days: +1.43%
  - ROC 50 days: +15.71%

Oil/Gold:
  - Component score: 80.0/100
  - Current value: 0.0160
  - Position vs EMA50: ABOVE
  - ROC 20 days: +25.23%
  - ROC 50 days: +22.53%
  - ⚠️ ANOMALY DETECTED - Significant deviation from the average
  → Rising energy demand

SP500/VIX:
  - Component score: 5.0/100
  - Current value: 272.0209
  - Position vs EMA50: BELOW
  - ROC 20 days: -32.20%
  - ROC 50 days: -47.14%
  → Contracting risk appetite

Commodities/T30y:
  - Component score: 80.0/100
  - Current value: 0.3126
  - Position vs EMA50: ABOVE
  - ROC 20 days: +12.46%
  - ROC 50 days: +21.21%
  - ⚠️ ANOMALY DETECTED - Significant deviation from the average
  → Economic growth expectations

SP500/Nasdaq:
  - Component score: 45.0/100
  - Current value: 0.2988
  - Position vs EMA50: ABOVE
  - ROC 20 days: -0.31%
  - ROC 50 days: +1.78%

============================================================
CONCLUSIONS AND RECOMMENDATIONS
============================================================

The market shows signs of weakness. Several ratios are in negative territory.
Risk appetite is declining. Increase caution.
Positioning: DEFENSIVE, favor safe-haven assets.


STRONGEST RATIOS:
  • Gold/USD: 95.0/100
  • Oil/Gold: 80.0/100
  • Commodities/T30y: 80.0/100

WEAKEST RATIOS:
  • SP500/Nasdaq: 45.0/100
  • DJ/Gold: 5.0/100
  • SP500/VIX: 5.0/100

============================================================
Analysis automatically generated by kbmeter.com
Date: 2026-03-11
📄 Detailed Asset Allocation Analysis
ASSET ALLOCATION & REGIME ANALYSIS - 2026-03-11
======================================================================

MARKET REGIME: MODERATE RISK-OFF
REGIME SCORE: 30.0/100

======================================================================
TREND AND VOLATILITY ANALYSIS
======================================================================

GLOBAL EQUITIES (ACWI):
  Short-Term Trend (5d): -1.34% | BELOW EMA 10
  Medium-Term Trend (20d): -2.89% | BELOW EMA 50
  Long-Term Trend (60d): +0.79% | ABOVE EMA 200

  Volatility 5d: 16.6%
  Volatility 20d: 13.5%
  Volatility 60d: 12.3%

COMMODITIES (DBC):
  Medium-Term Trend (20d): +14.33% | ABOVE EMA 50
  Volatility 20d: 22.9%

ACWI/BND Correlation (30d): -0.145

REGIME INTERPRETATION:
The market is showing signs of caution. Trends are deteriorating across some horizons
or volatility is increasing. Investors are reducing risk exposure.
Suggested positioning: UNDERWEIGHT equities, favor quality and defensive assets.

======================================================================
ASSET RANKING - WHICH IS PERFORMING BEST?
======================================================================

🥇 1. Commodities (DBC) - SCORE: 100/100
     Price: $27.60
     Trend: ABOVE EMA10 | ABOVE EMA50 | ABOVE EMA200
     Performance: 5d +5.59% | 20d +14.33% | 60d +23.45%
     Volatility: 5d 28.9% | 20d 22.9% | 60d 21.6%
     Drawdown: 0.00%
     → Asset in STRONG HEALTH: positive trends and controlled volatility

🥈 2. Global Bonds (BND) - SCORE: 50/100
     Price: $74.22
     Trend: BELOW EMA10 | BELOW EMA50 | ABOVE EMA200
     Performance: 5d -0.39% | 20d -0.03% | 60d +0.58%
     Volatility: 5d 3.6% | 20d 3.6% | 60d 3.1%
     Drawdown: -0.96%
     → Asset in NEUTRAL condition: mixed signals

🥉 3. Global Equities (ACWI) - SCORE: 40/100
     Price: $143.05
     Trend: BELOW EMA10 | BELOW EMA50 | ABOVE EMA200
     Performance: 5d -1.34% | 20d -2.89% | 60d +0.79%
     Volatility: 5d 16.6% | 20d 13.5% | 60d 12.3%
     Drawdown: -3.77%
     → Asset in WEAK condition: negative trends or elevated volatility

======================================================================
CORRELATION ANALYSIS - CURRENT vs HISTORICAL
======================================================================

ACWI/BND:
  Current correlation (30d): -0.145
  Historical average (1 year): +0.150
  Deviation: -0.294
  → Weak correlation: moderate diversification

BND/DBC:
  Current correlation (30d): -0.303
  Historical average (1 year): -0.176
  Deviation: -0.127

ACWI/DBC:
  Current correlation (30d): +0.034
  Historical average (1 year): +0.133
  Deviation: -0.100

======================================================================
OPERATIONAL SUMMARY
======================================================================

STRONGEST ASSET: Commodities (Score: 100/100)
WEAKEST ASSET: Global Equities (Score: 40/100)

SUGGESTED ACTION: Reduce exposure to the weakest asset, favor defensive assets.
DIVERSIFICATION: EXCELLENT - Asset classes are moving independently.

======================================================================
Analysis automatically generated by kbmeter.com
Date: 2026-03-11
On the macro front, as mentioned, today’s key release is the U.S. February inflation data, expected to remain stable. Also due are producer price data in Japan and retail sales data in Spain.
Already a subscriber? Login here
NOTES AND WARNINGS
Data compiled by kbmeter.com. Analysis date: 11 March 2026 - 7:36 AM GMT+1
This content is provided for informational purposes only and should not be considered financial advice. All scores and assessments are based on the previous trading day’s closing prices. Futures indications refer to the date and time of the analysis.