Financial markets remain cautious ahead of earnings from U.S. financial heavyweights
The phase of caution in financial markets continues, with investors focused on deciphering developments on the U.S. monetary policy front. The underlying backdrop still points to a moderately positive/neutral sentiment. The earnings season may provide interesting cues to give markets clearer direction, while geopolitical uncertainties and the highly anticipated Supreme Court decision on tariffs remain in the background.
Market Weather Map
January 14, 2026
US Equities
Eu Equities
Asia Equities
Commodities
Bonds
Dollar Index
Technology
Gold
Oil
Crypto
Market Summary
📊 Global Futures – Pre-Market Sentiment
- Nikkei 225 derived: +0.80%
- IBEX 35 derived: +0.33%
- Hang Seng derived: +0.10%
- CSI 300: -0.53%
- FTSE MIB derived: -0.46%
- Dow Jones: -0.29%
Pre-Open Futures: Global futures point to a moderately risk-off sentiment (average -0.06%), with the U.S. slightly negative (-0.22%), Europe slightly negative (-0.04%), and Asia slightly positive (+0.12%).
Financial markets are showing a moderately positive sentiment today, with risk indicators holding around their medium-term moving averages. Equities maintain an overall positive tone (score 69), while intermarket analysis points to a Market Health Score of 53/100 (neutral). Worth noting is the sharp rise in commodities, driven mainly by the surge in metal prices (both precious and industrial).
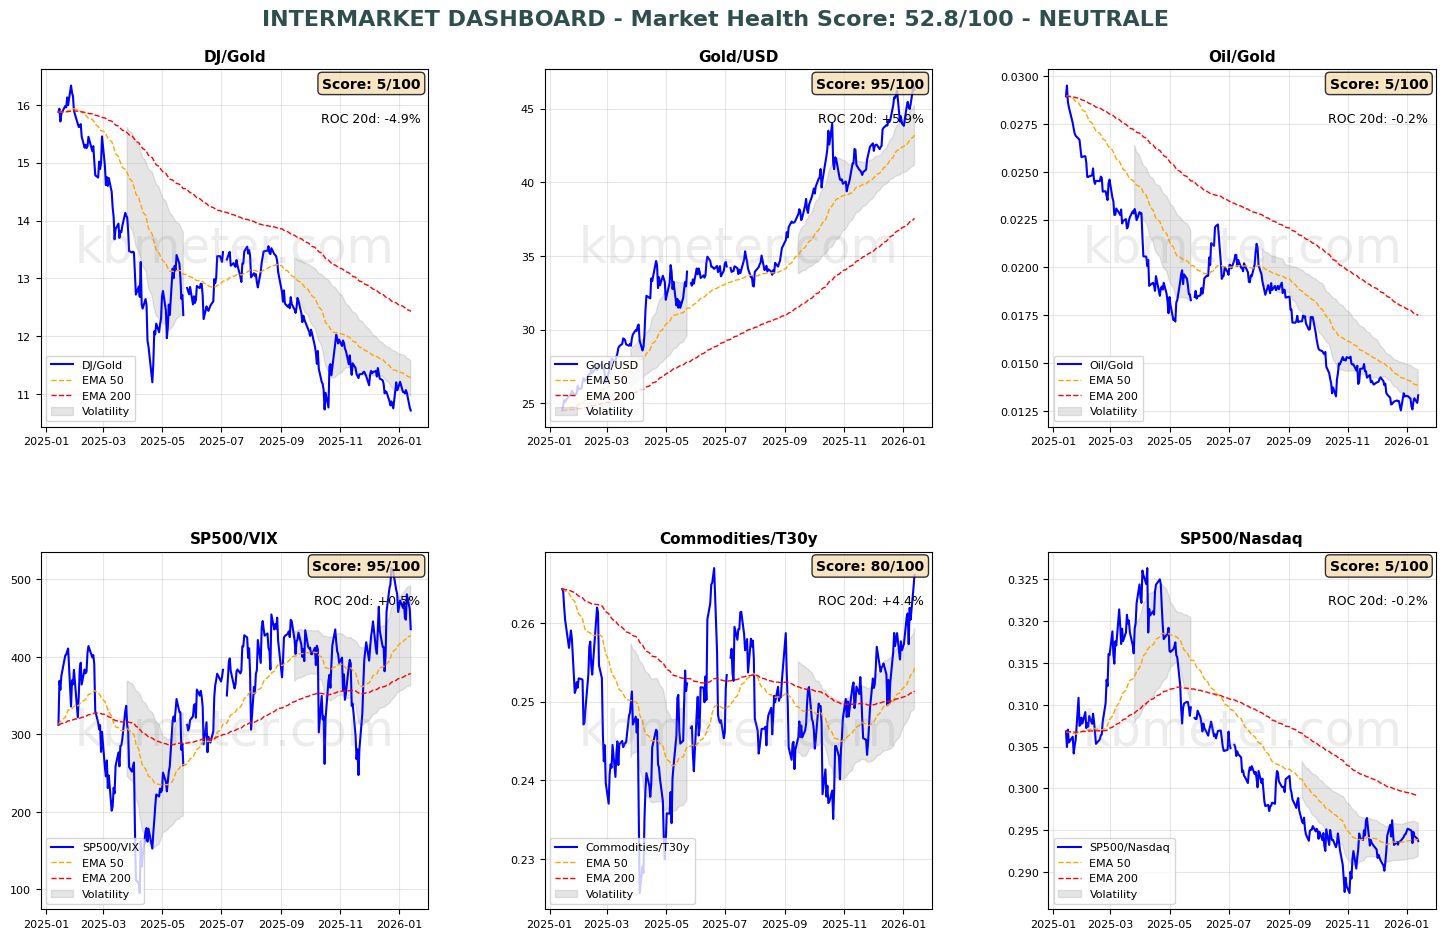
📄 Detailed Intermarket Analysis
INTERMARKET ANALYSIS - 2026-01-14
============================================================

MARKET HEALTH SCORE: 52.8/100
SENTIMENT: NEUTRAL

============================================================
SUMMARY OF KEY RATIOS
============================================================


DJ/Gold:
  - Component score: 5.0/100
  - Current value: 10.7191
  - Position vs EMA50: BELOW
  - 20-day ROC: -4.88%
  - 50-day ROC: -9.75%
  → Flight to safe havens

Gold/USD:
  - Component score: 95.0/100
  - Current value: 46.2948
  - Position vs EMA50: ABOVE
  - 20-day ROC: +5.94%
  - 50-day ROC: +15.16%

Oil/Gold:
  - Component score: 5.0/100
  - Current value: 0.0133
  - Position vs EMA50: BELOW
  - 20-day ROC: -0.25%
  - 50-day ROC: -11.98%
  → Declining energy demand

SP500/VIX:
  - Component score: 95.0/100
  - Current value: 435.7785
  - Position vs EMA50: ABOVE
  - 20-day ROC: +0.46%
  - 50-day ROC: +8.01%
  → Expanding risk appetite

Commodities/T30y:
  - Component score: 80.0/100
  - Current value: 0.2661
  - Position vs EMA50: ABOVE
  - 20-day ROC: +4.41%
  - 50-day ROC: +8.43%
  - ⚠️ ANOMALY DETECTED – Significant deviation from the average
  → Economic growth expectations

SP500/Nasdaq:
  - Component score: 5.0/100
  - Current value: 0.2937
  - Position vs EMA50: BELOW
  - 20-day ROC: -0.22%
  - 50-day ROC: +1.52%

============================================================
CONCLUSIONS AND RECOMMENDATIONS
============================================================

The market is in a neutral/sideways phase. Conflicting signals across ratios.
A clear direction is lacking. Await confirmation.
Positioning: BALANCED, avoid excesses.


STRONGEST RATIOS:
  • Gold/USD: 95.0/100
  • SP500/VIX: 95.0/100
  • Commodities/T30y: 80.0/100

WEAKEST RATIOS:
  • DJ/Gold: 5.0/100
  • Oil/Gold: 5.0/100
  • SP500/Nasdaq: 5.0/100

============================================================
Analysis automatically generated by kbmeter.com
Date: 2026-01-14
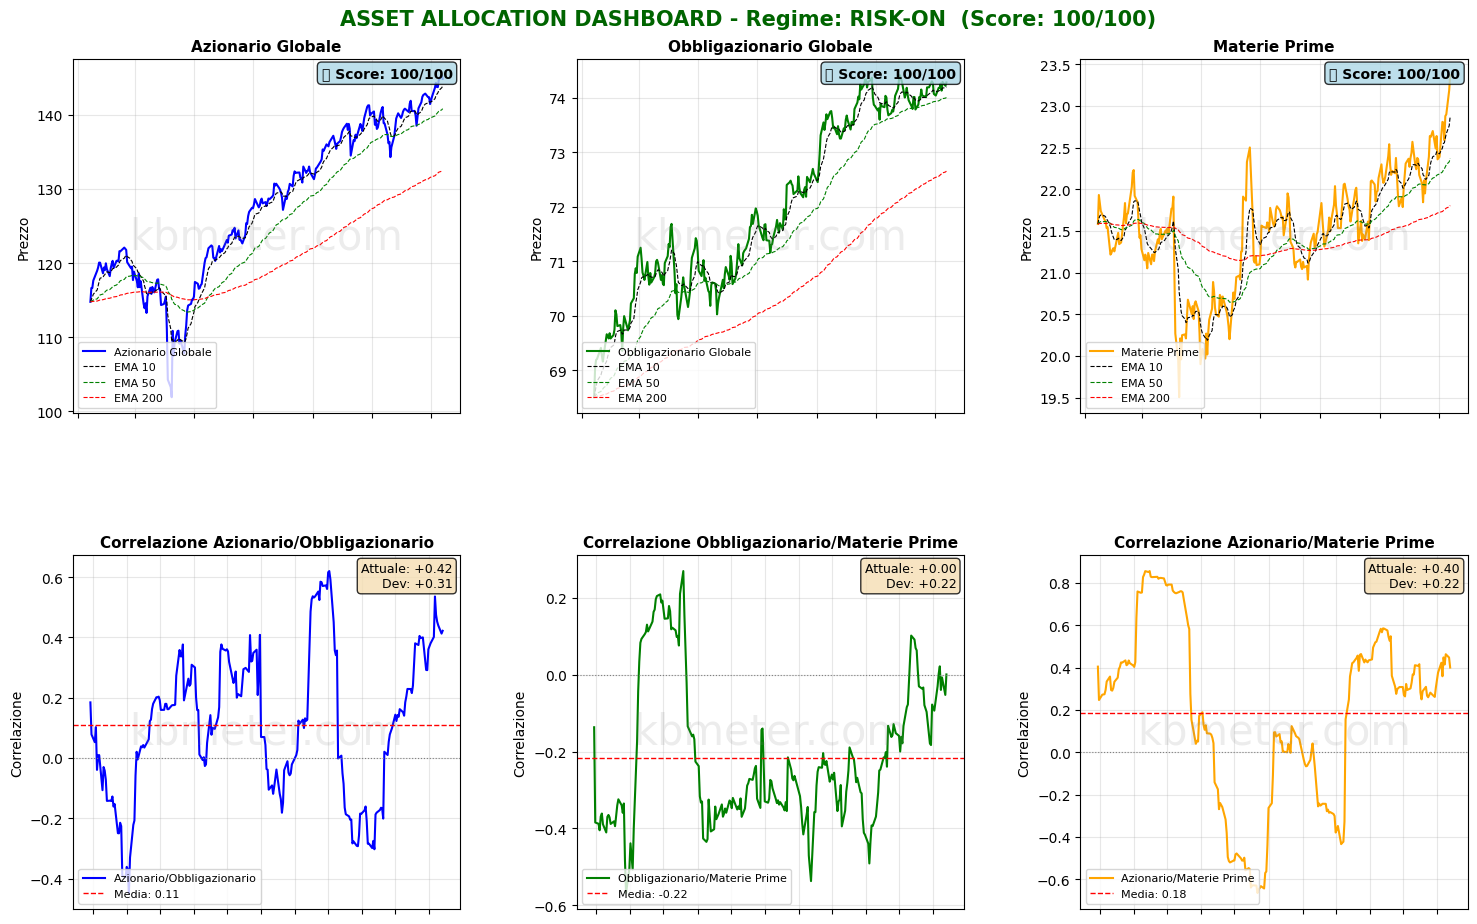
📄 Detailed Asset Allocation Analysis
ASSET ALLOCATION & REGIME ANALYSIS - 2026-01-14
======================================================================

MARKET REGIME: RISK-ON
REGIME SCORE: 100.0/100

======================================================================
TREND AND VOLATILITY ANALYSIS
======================================================================

GLOBAL EQUITIES (ACWI):
  Short-Term Trend (5d): +0.75% | ABOVE EMA 10
  Medium-Term Trend (20d): +3.08% | ABOVE EMA 50
  Long-Term Trend (60d): +5.43% | ABOVE EMA 200

  5d Volatility: 7.4%
  20d Volatility: 8.7%
  60d Volatility: 10.9%

COMMODITIES (DBC):
  Medium-Term Trend (20d): +5.90% | ABOVE EMA 50
  20d Volatility: 14.7%

ACWI/BND Correlation (30d): 0.422

REGIME INTERPRETATION:
The market is in a risk-on regime. Equities show positive trends across multiple
time horizons and volatility remains contained. Investors are favoring risky assets.
Suggested positioning: OVERWEIGHT equities.

======================================================================
ASSET RANKING – WHO IS PERFORMING BEST?
======================================================================

🥇 1. Global Equities (ACWI) - SCORE: 100/100
     Price: $144.89
     Trend: ABOVE EMA10 | ABOVE EMA50 | ABOVE EMA200
     Performance: 5d +0.75% | 20d +3.08% | 60d +5.43%
     Volatility: 5d 7.4% | 20d 8.7% | 60d 10.9%
     Drawdown: -0.34%
     → Asset in STRONG HEALTH: positive trends and controlled volatility

🥈 2. Global Bonds (BND) - SCORE: 100/100
     Price: $74.28
     Trend: ABOVE EMA10 | ABOVE EMA50 | ABOVE EMA200
     Performance: 5d +0.03% | 20d +0.55% | 60d +0.18%
     Volatility: 5d 2.5% | 20d 2.3% | 60d 2.9%
     Drawdown: -0.18%
     → Asset in STRONG HEALTH: positive trends and controlled volatility

🥉 3. Commodities (DBC) - SCORE: 100/100
     Price: $23.37
     Trend: ABOVE EMA10 | ABOVE EMA50 | ABOVE EMA200
     Performance: 5d +3.45% | 20d +5.90% | 60d +9.21%
     Volatility: 5d 14.8% | 20d 14.7% | 60d 13.1%
     Drawdown: 0.00%
     → Asset in STRONG HEALTH: positive trends and controlled volatility

======================================================================
CORRELATION ANALYSIS – CURRENT vs HISTORICAL
======================================================================

ACWI/BND:
  Current correlation (30d): +0.422
  Historical average (1 year): +0.110
  Deviation: +0.312
  ⚠️ SIGNIFICANT DEVIATION from historical average
  → Positive correlation: diversification IMPAIRED

BND/DBC:
  Current correlation (30d): +0.001
  Historical average (1 year): -0.217
  Deviation: +0.218

ACWI/DBC:
  Current correlation (30d): +0.400
  Historical average (1 year): +0.184
  Deviation: +0.217

======================================================================
OPERATIONAL SUMMARY
======================================================================

STRONGEST ASSET: Global Equities (Score: 100/100)
WEAKEST ASSET: Commodities (Score: 100/100)

SUGGESTED ACTION: Favor the strongest asset, maintain risk exposure.
DIVERSIFICATION: EXCELLENT – Asset classes are moving independently.

======================================================================
Analysis automatically generated by kbmeter.com
Date: 2026-01-14
On the macro front, the day features data on Chinese exports, as well as U.S. November retail sales and producer prices.
As for earnings, results are due today from three major financial institutions: Wells Fargo, Bank of America, and Citigroup
Already a subscriber? Login here
NOTES AND WARNINGS
Data compiled by kbmeter.com. Analysis date: 14 January 2026 - 7:48 AM GMT+1
This content is provided for informational purposes only and should not be considered financial advice. All scores and assessments are based on the previous trading day’s closing prices. Futures indications refer to the date and time of the analysis.