
Financial markets attempt to regain footing amid earnings season and monetary policy decisions
Financial markets attempt to regain footing after several turbulent sessions, as investors await another round of heavyweight earnings (AMD today, followed later in the week by Amazon and Alphabet).
Attention is focused on global bonds, which have slipped below their medium-term moving average, and on the Reserve Bank of Australia, which has returned to raising interest rates. Overall sentiment remains neutral, while futures point to a mildly positive open for both European and U.S. equities.
Market Weather Map
February 3, 2026
US Equities
Eu Equities
Asia Equities
Commodities
Bonds
Dollar Index
Technology
Gold
Oil
Crypto
Market Summary
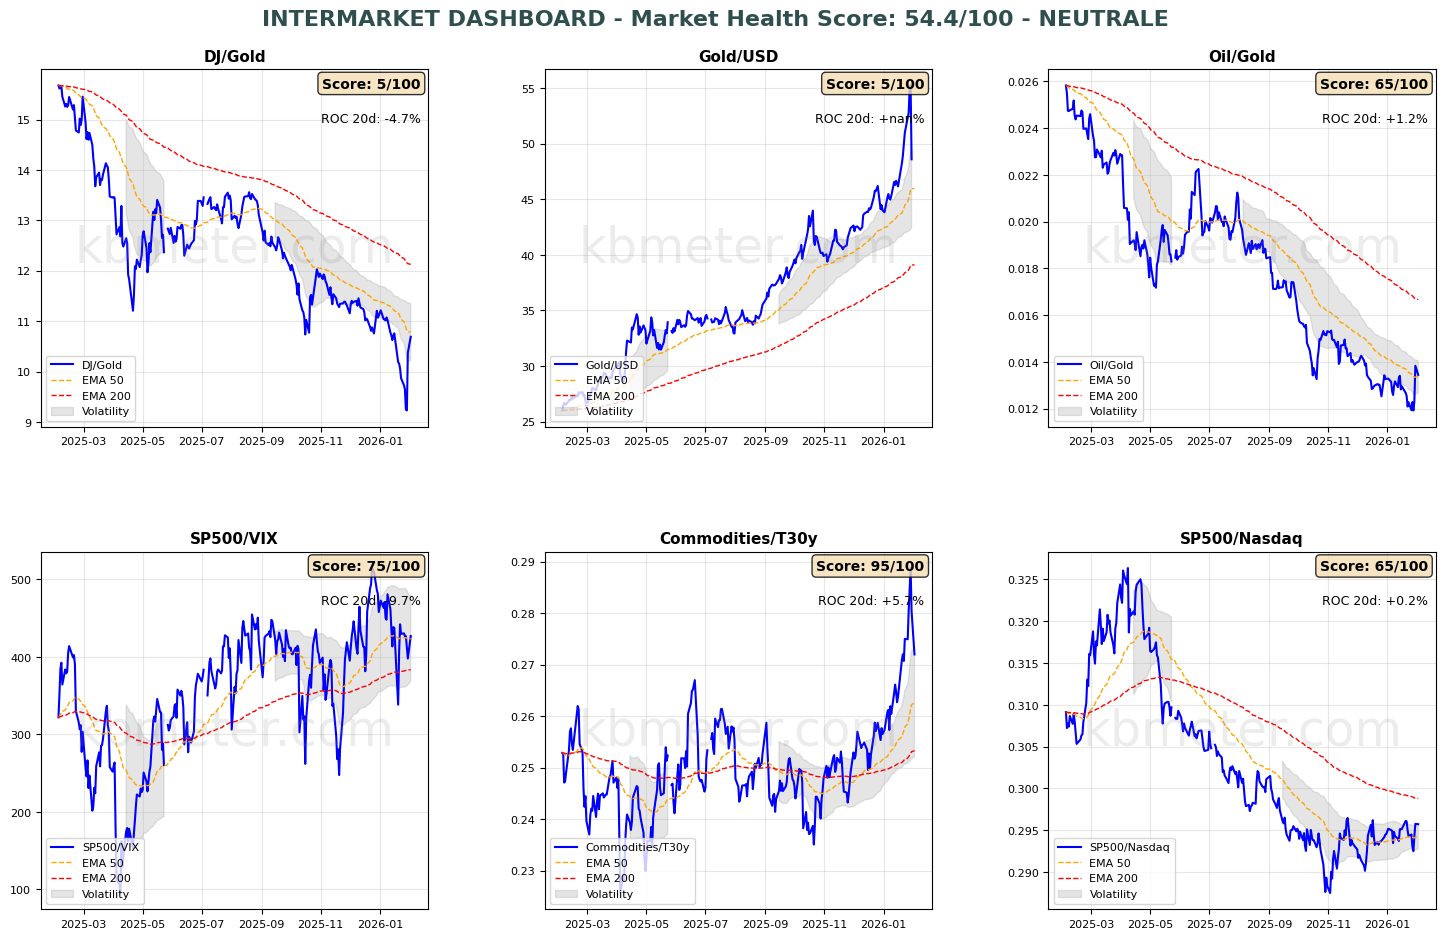
Market indicators today signal a neutral tone. Intermarket analysis shows a Market Health Score of 54/100, consistent with a neutral environment. Our intermarket dashboards continue to reflect the impact of the sharp selloff in gold and still point to subdued risk appetite among investors. Notably, global bonds have broken below their 50-day moving average, another sign that the asset class is entering a more sideways phase.
Futures – Pre-Market: global futures indicate a moderate risk-on bias (+0.27% on average), with the U.S. slightly positive (+0.26%), Europe modestly higher (+0.50%), and Asia slightly negative (-0.40%).
📊 Global Futures – Pre-Market Sentiment
- Nikkei 225 derived: +1.52%
- IBEX 35 derived: +1.33%
- FTSE MIB derived: +1.05%
- CSI 300: -2.41%
- Hang Seng derived: -0.31%
- FTSE 100 derived: -0.02%
📄 Detailed Intermarket Analysis
INTERMARKET ANALYSIS - 2026-02-03
============================================================

MARKET HEALTH SCORE: 54.4/100
SENTIMENT: NEUTRAL

============================================================
KEY RATIO SUMMARY
============================================================


DJ/Gold:
  - Component score: 5.0/100
  - Current value: 10.6885
  - Position vs EMA50: BELOW
  - 20-day ROC: -4.69%
  - 50-day ROC: -5.82%
  → Flight to safe havens

Gold/USD:
  - Component score: 5.0/100
  - Current value: nan
  - Position vs EMA50: BELOW
  - 20-day ROC: +nan%
  - 50-day ROC: +nan%

Oil/Gold:
  - Component score: 65.0/100
  - Current value: 0.0134
  - Position vs EMA50: ABOVE
  - 20-day ROC: +1.18%
  - 50-day ROC: -10.12%
  → Rising energy demand

SP500/VIX:
  - Component score: 75.0/100
  - Current value: 426.9547
  - Position vs EMA50: ABOVE
  - 20-day ROC: -9.67%
  - 50-day ROC: +59.30%

Commodities/T30y:
  - Component score: 95.0/100
  - Current value: 0.2720
  - Position vs EMA50: ABOVE
  - 20-day ROC: +5.72%
  - 50-day ROC: +7.45%
  → Economic growth expectations

SP500/Nasdaq:
  - Component score: 65.0/100
  - Current value: 0.2957
  - Position vs EMA50: ABOVE
  - 20-day ROC: +0.18%
  - 50-day ROC: +0.25%

============================================================
CONCLUSIONS AND RECOMMENDATIONS
============================================================

The market is in a neutral/sideways phase. Mixed signals across key ratios.
A clear directional bias is lacking. Wait for confirmation.
Positioning: BALANCED, avoid excesses.


STRONGEST RATIOS:
  • Commodities/T30y: 95.0/100
  • SP500/VIX: 75.0/100
  • Oil/Gold: 65.0/100

WEAKEST RATIOS:
  • SP500/Nasdaq: 65.0/100
  • DJ/Gold: 5.0/100
  • Gold/USD: 5.0/100

============================================================
Analysis automatically generated by kbmeter.com
Date: 2026-02-03
📄 Detailed Asset Allocation Analysis
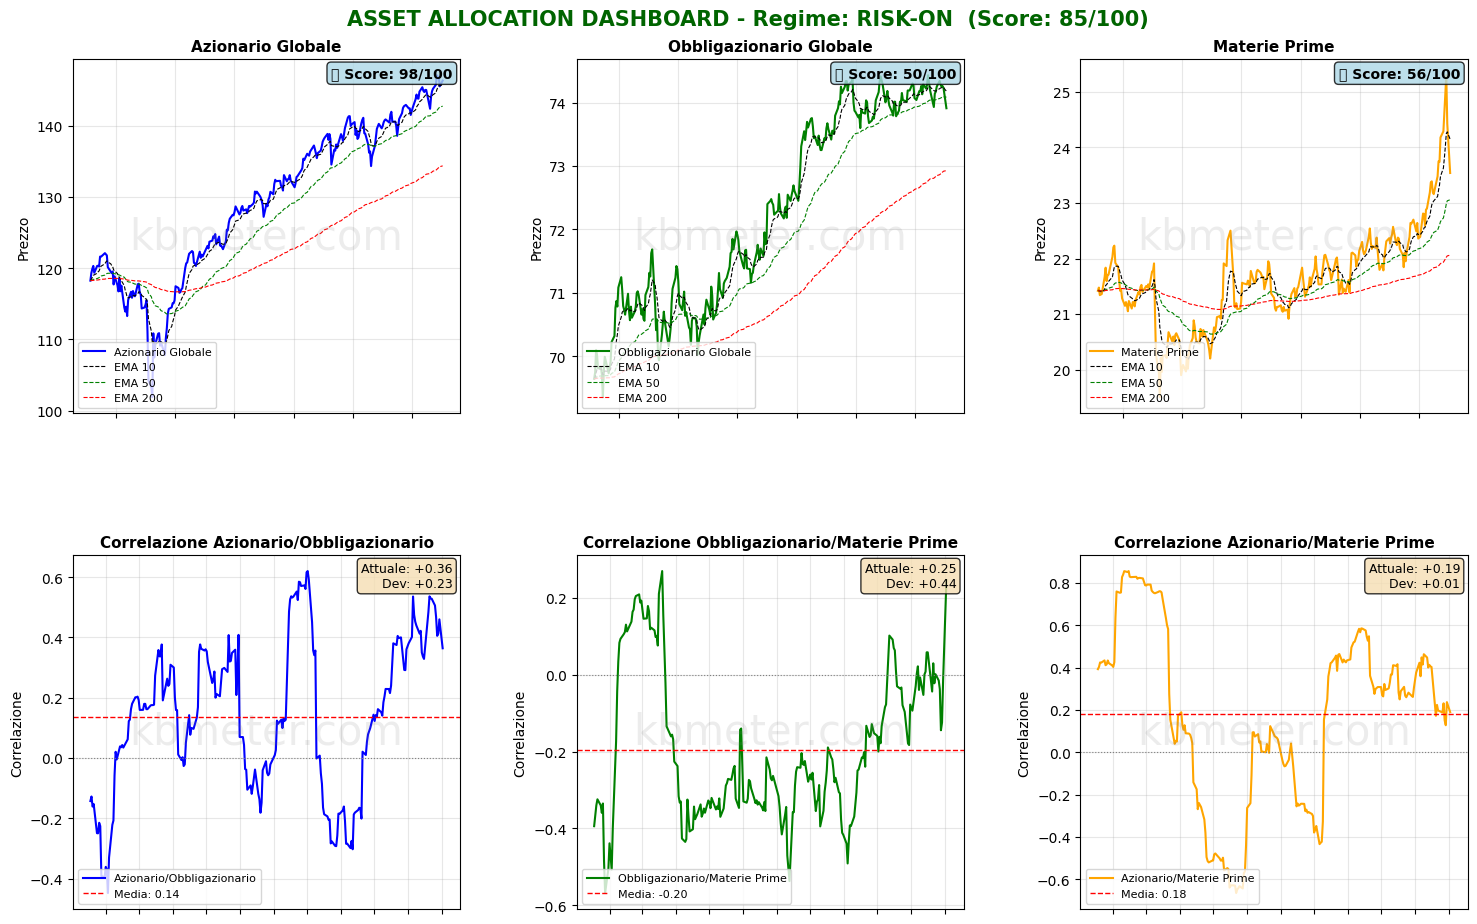
ASSET ALLOCATION & REGIME ANALYSIS - 2026-02-03
======================================================================

MARKET REGIME: RISK-ON
REGIME SCORE: 85.0/100

======================================================================
TREND AND VOLATILITY ANALYSIS
======================================================================

GLOBAL EQUITIES (ACWI):
  Short-Term Trend (5d): -0.51% | ABOVE EMA 10
  Medium-Term Trend (20d): +1.83% | ABOVE EMA 50
  Long-Term Trend (60d): +5.01% | ABOVE EMA 200

  Volatility 5d: 10.7%
  Volatility 20d: 10.6%
  Volatility 60d: 11.1%

COMMODITIES (DBC):
  Medium-Term Trend (20d): +3.20% | ABOVE EMA 50
  Volatility 20d: 24.5%

ACWI/BND Correlation (30d): 0.364

REGIME INTERPRETATION:
The market is in a risk-on regime. Equities show positive trends across multiple
time horizons and volatility remains contained. Investors favor risk assets.
Suggested positioning: OVERWEIGHT equities.

======================================================================
ASSET RANKING – WHO IS PERFORMING BEST?
======================================================================

🥇 1. Global Equities (ACWI) - SCORE: 98/100
     Price: $146.31
     Trend: ABOVE EMA10 | ABOVE EMA50 | ABOVE EMA200
     Performance: 5d -0.51% | 20d +1.83% | 60d +5.01%
     Volatility: 5d 10.7% | 20d 10.6% | 60d 11.1%
     Drawdown: -0.51%
     → Asset in STRONG HEALTH: positive trends and controlled volatility

🥈 2. Commodities (DBC) - SCORE: 56/100
     Price: $23.54
     Trend: BELOW EMA10 | ABOVE EMA50 | ABOVE EMA200
     Performance: 5d -4.39% | 20d +3.20% | 60d +6.63%
     Volatility: 5d 42.7% | 20d 24.5% | 60d 17.1%
     Drawdown: -6.96%
     → Asset in FAIR condition: mostly positive signals

🥉 3. Global Bonds (BND) - SCORE: 50/100
     Price: $73.91
     Trend: BELOW EMA10 | BELOW EMA50 | ABOVE EMA200
     Performance: 5d -0.50% | 20d -0.36% | 60d +0.42%
     Volatility: 5d 2.8% | 20d 3.0% | 60d 2.9%
     Drawdown: -0.70%
     → Asset in NEUTRAL condition: mixed signals

======================================================================
CORRELATION ANALYSIS – CURRENT vs HISTORICAL
======================================================================

ACWI/BND:
  Current correlation (30d): +0.364
  Historical average (1 year): +0.137
  Deviation: +0.228
  → Positive correlation: diversification COMPROMISED

BND/DBC:
  Current correlation (30d): +0.246
  Historical average (1 year): -0.196
  Deviation: +0.442
  ⚠️ SIGNIFICANT DEVIATION from historical average

ACWI/DBC:
  Current correlation (30d): +0.190
  Historical average (1 year): +0.180
  Deviation: +0.010

======================================================================
OPERATIONAL SUMMARY
======================================================================

STRONGEST ASSET: Global Equities (Score: 98/100)
WEAKEST ASSET: Global Bonds (Score: 50/100)

SUGGESTED ACTION: Favor the strongest asset, maintain risk exposure.
DIVERSIFICATION: EXCELLENT – asset classes are moving independently.

======================================================================
Analysis automatically generated by kbmeter.com
Date: 2026-02-03
On the macro front, markets are digesting the Australian central bank’s decision to raise rates, while today’s calendar includes French inflation data and U.S. unemployment figures.
Earnings watch: AMD takes center stage today as investors look for signs of renewed momentum in tech. Results from PepsiCo, Merck & Co. and Pfizer are also in focus.
Already a subscriber? Login here
NOTES AND WARNINGS
Data compiled by kbmeter.com. Analysis date: 3 February 2026 - 7:53 AM GMT+1
This content is provided for informational purposes only and should not be considered financial advice. All scores and assessments are based on the previous trading day’s closing prices. Futures indications refer to the date and time of the analysis.
