
Financial Market Sentiment Holds in Neutral Territory as Bonds Show Signs of Life and Asia Equities Remain Volatile
Financial markets are showing signs of stabilization towards the end of the week. The key development is the return of global bonds above the 50-point threshold on our Health Score, providing a further indication that the market may have moved past its bottom (confirmation is still lacking, so caution remains warranted). Meanwhile, investors appear to be recalibrating their expectations for the technology sector and diversifying into other sectors. Asia remains the most volatile market. Following the turmoil in semiconductors, Indonesia recorded its steepest single-day decline since 1988 in response to MSCI’s warning. Sentiment remains neutral, while futures point to a positive opening for both the US and European markets.
Market Weather Map
October 16, 2026
US Equities
Eu Equities
Asia Equities
Commodities
Bonds
Dollar Index
Technology
Gold
Oil
Crypto
Market Summary
Do you want to see the score details for all assets monitored by KBMeter?
Try free for 14 days →Financial markets sentiment
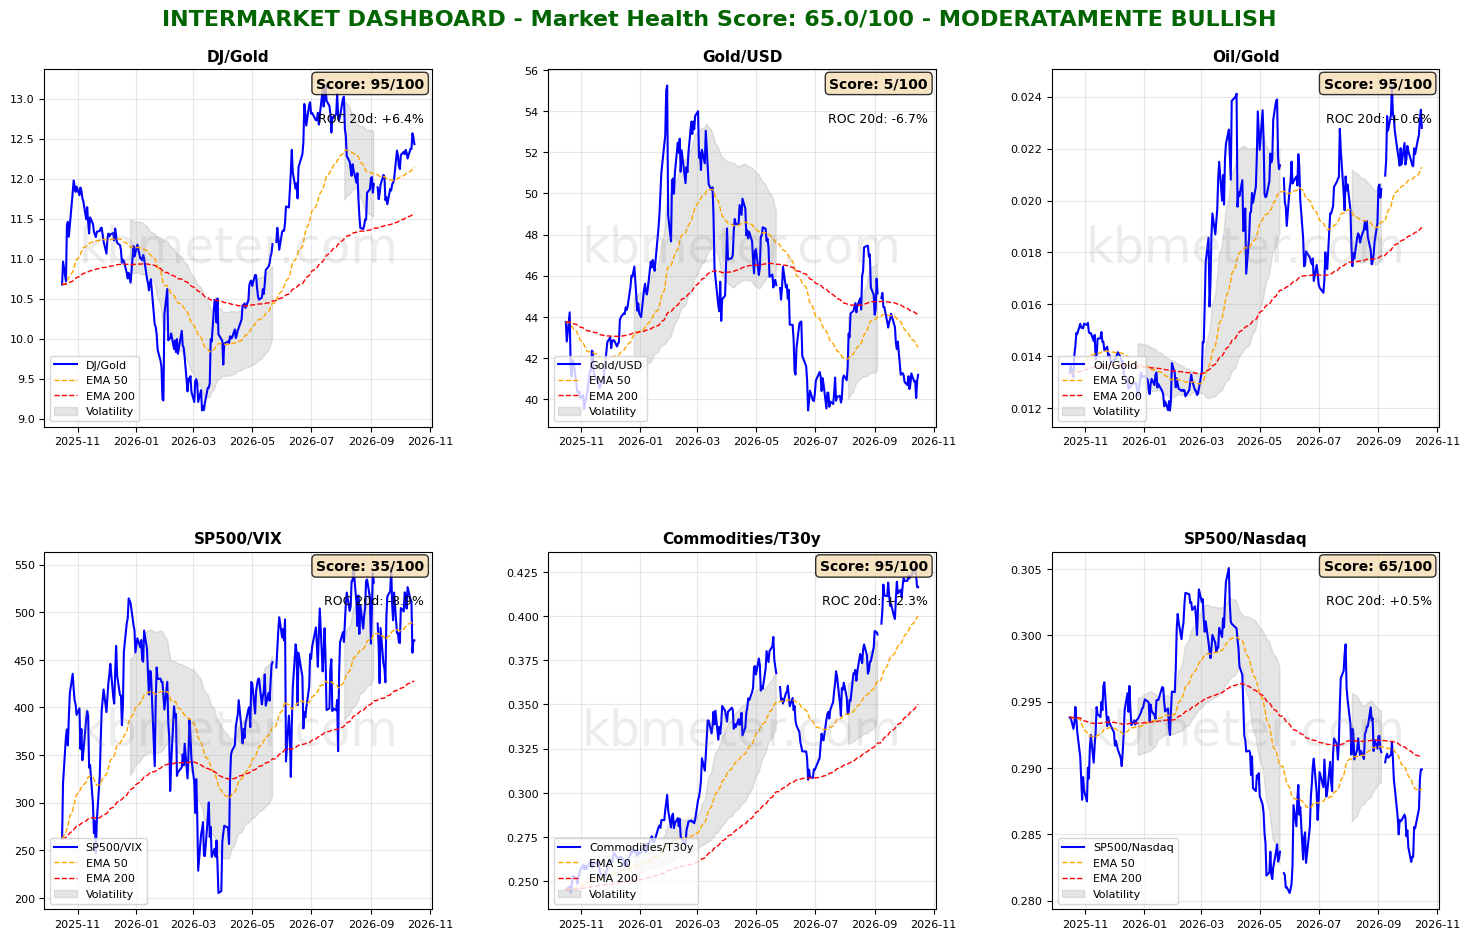
Financial markets are currently showing neutral sentiment. Our intermarket analysis indicates a Market Health Score of 65/100. Our intermarket dashboards show few changes compared with the previous analysis. Despite the recovery in equities, risk appetite remains unchanged, with the S&P 500/VIX ratio still below its medium-term moving average and the S&P 500/Nasdaq ratio halfway between its medium-term and long-term moving averages. A modest recovery in gold has stabilized the Gold/Dollar ratio near its lows, while inflation expectations remain elevated.
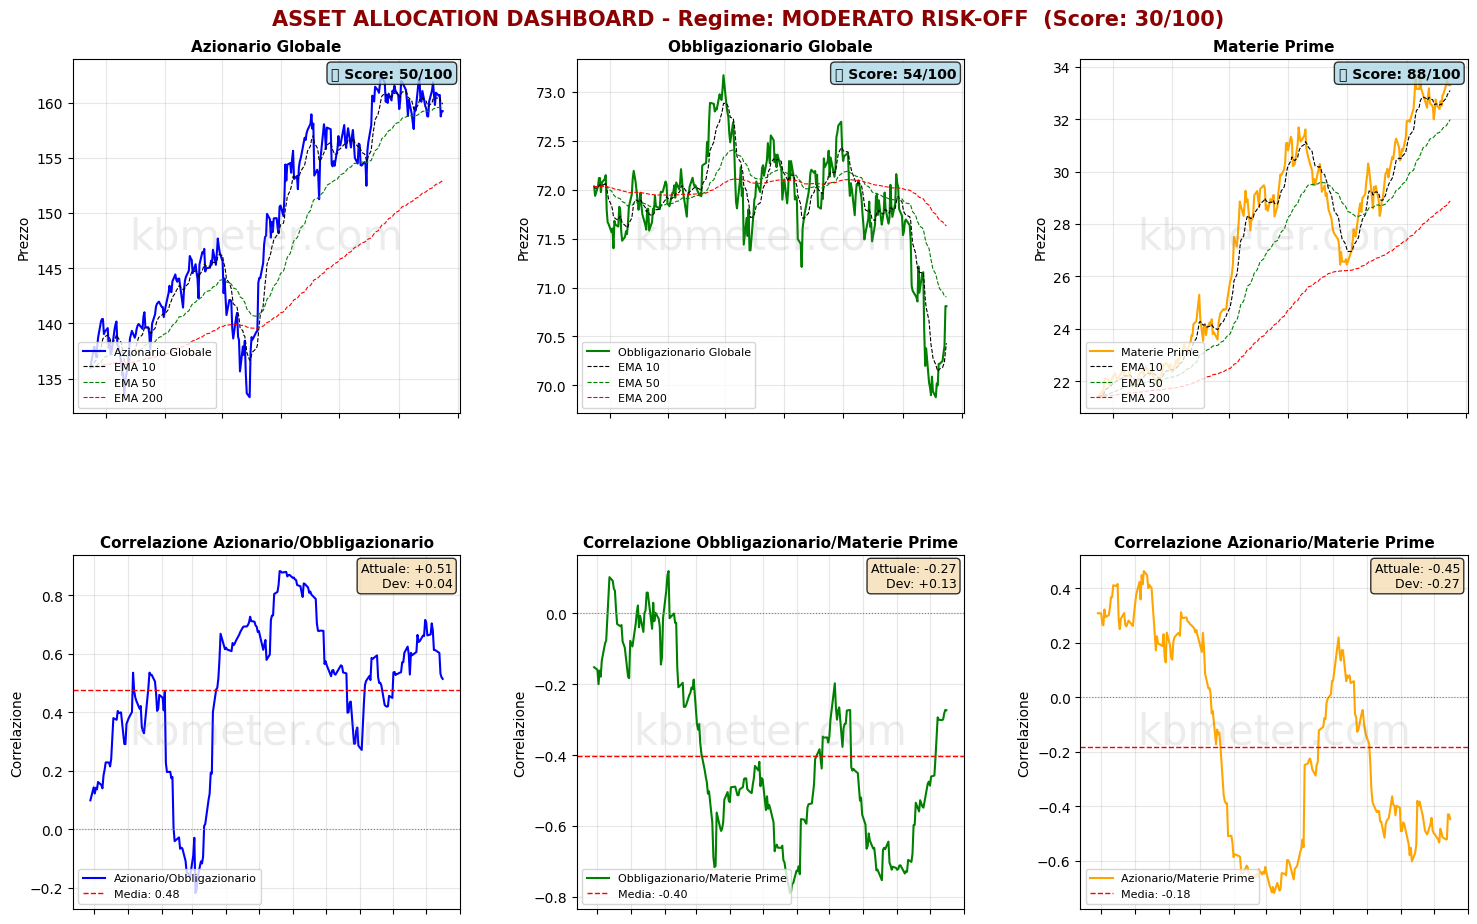
The performance of the major asset classes is considerably more interesting. Equities remain in the lower part of their short-term trading range, just below their medium-term moving average. Global bonds — the real headline of the day — are recovering from their lows and approaching a key initial target: moving back above their medium-term moving average. Considerable caution is still required, but evidence that the current bearish move may be approaching a bottom is gradually building. There are no significant developments in commodities.
Our market weather map confirms the picture outlined above. Bonds have moved back above the 50-point threshold (neutral territory), gaining seven points on the score over the past week. As yields decline, gold is also recovering some ground and has moved out of the weakness zone, while the technology sector continues to face challenging conditions.
The US dollar remains firmly above 60 points on the score, and oil is also gaining ground. As for equities, the US and European markets remain in neutral territory, while conditions in Asia remain challenging, following Indonesia’s sharp sell-off yesterday.
Global Futures – Pre-Market Sentiment
Global futures point to a moderately risk-on sentiment, with an average gain of +0.20%.
- US: Slightly positive (+0.18%)
- Europe: Slightly positive (+0.35%)
- Asia: Negative (-0.65%)
📊 Global Futures – Pre-Market Sentiment
- Taiwan: +1.62%
- Euro Stoxx 50: +0.76%
- DAX: +0.76%
- CSI 300: -2.65%
- FTSE MIB: -0.19%
- FTSE 100: -0.02%
Macroeconomic calendar
On the macroeconomic front, the week concludes with the release of US industrial production data and figures on international trade for September. In the Eurozone, the final September inflation reading is due.
Already a subscriber? Login here
NOTES AND WARNINGS
Data compiled by kbmeter.com. Analysis date: 16 October 2026 - 8:16 AM GMT+1
This content is provided for informational purposes only and should not be considered financial advice. All scores and assessments are based on the previous trading day’s closing prices. Futures indications refer to the date and time of the analysis.