
Fed Rate Hike Could Offer Stocks a Measure of Relief
Today is Fed decision day, with markets now pricing in as a near certainty (more than 80% probability) the first rate hike of the Warsh era. Comments from White House economic adviser Kevin Hassett appear to have somehow given the green light to the move, despite Trump’s vocal statements. Paradoxically, the announcement of a rate hike could restore some degree of calm to equity markets (with the score having been in slow decline over the past month and the trend component at one-year lows), confirming that the sheriff (the Fed) is in town and that it has both the willingness and the independence to tackle the inflation problem.
The message coming from the Fed, however, does not appear likely to have much of an impact on the trend in long-term US Treasury yields. Yesterday’s $13 billion 20-year Treasury auction closed with weak demand, while the 10-year yield hit its highest level since 2007, moving above the psychologically important 5% threshold. The problem appears to run deeper than the “simple” inflation outlook.
Overall, sentiment remains neutral, while futures point to a positive opening in the US and a flat start in Europe.
Market Weather Map
September 16, 2026
US Equities
Eu Equities
Asia Equities
Commodities
Bonds
Dollar Index
Technology
Gold
Oil
Crypto
Do you want to see the score details for all assets monitored by KBMeter?
Try free for 14 days →Financial markets sentiment
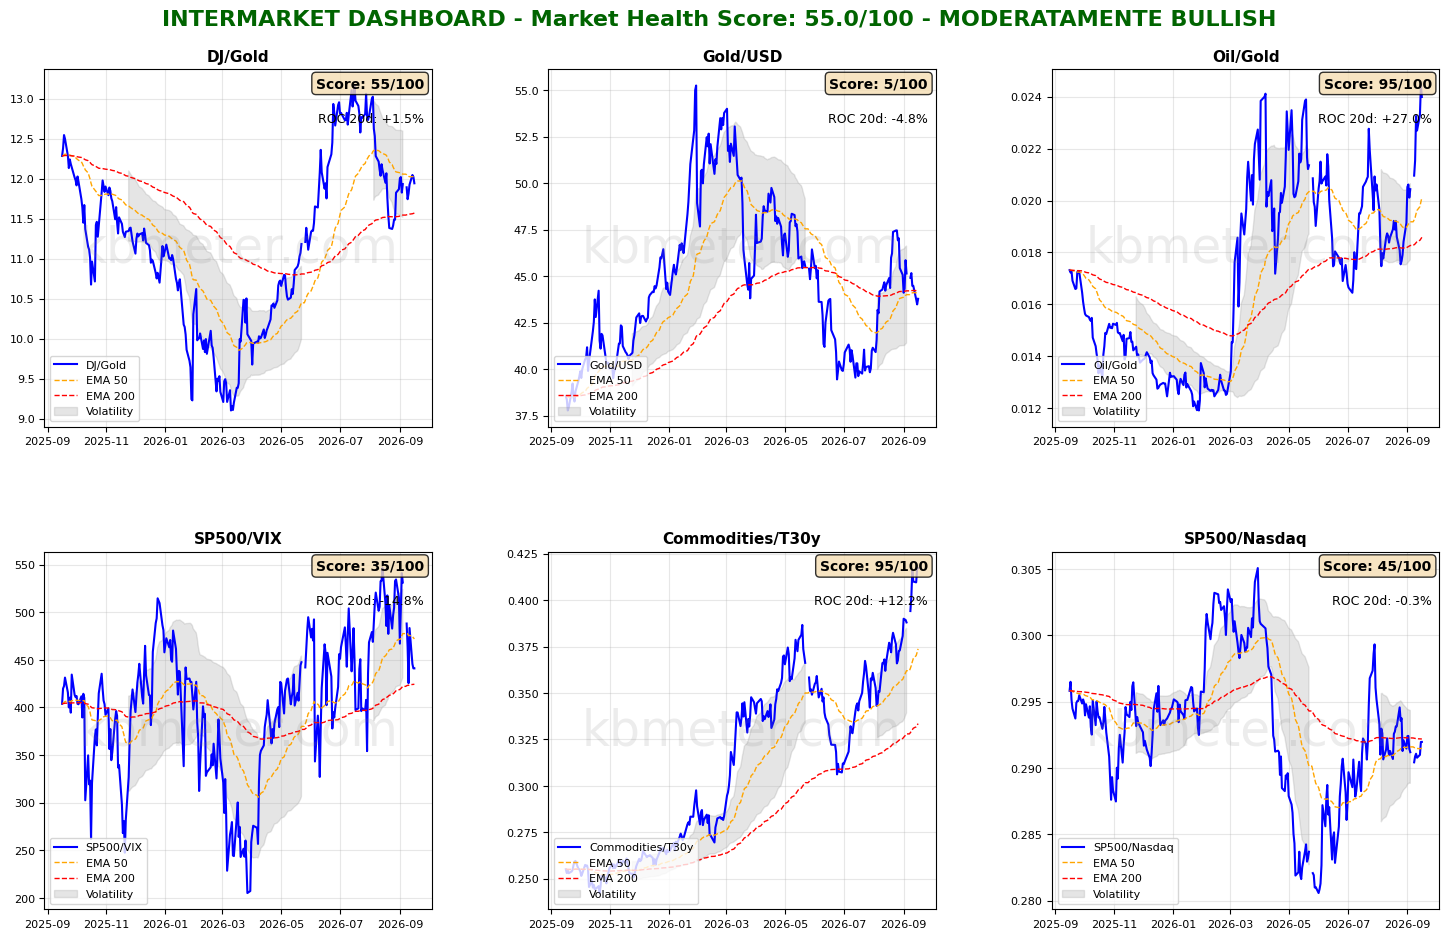
Financial markets are showing neutral sentiment today. Intermarket analysis points to a Market Health Score of 55/100. The cautious phase in financial markets continues, and our intermarket dashboards show several indicators compressed between their long-term and medium-term moving averages. This is the case for the Dow/Gold ratio and the S&P 500/VIX ratio, i.e. the two indicators of risk appetite. The S&P 500/Nasdaq ratio is also compressed between the moving averages, although in this case they are inverted.
The strength in commodities continues, with the Commodities/Bond ratio still at period highs, while the Oil/Gold ratio is rising further and has reached a new one-year high.
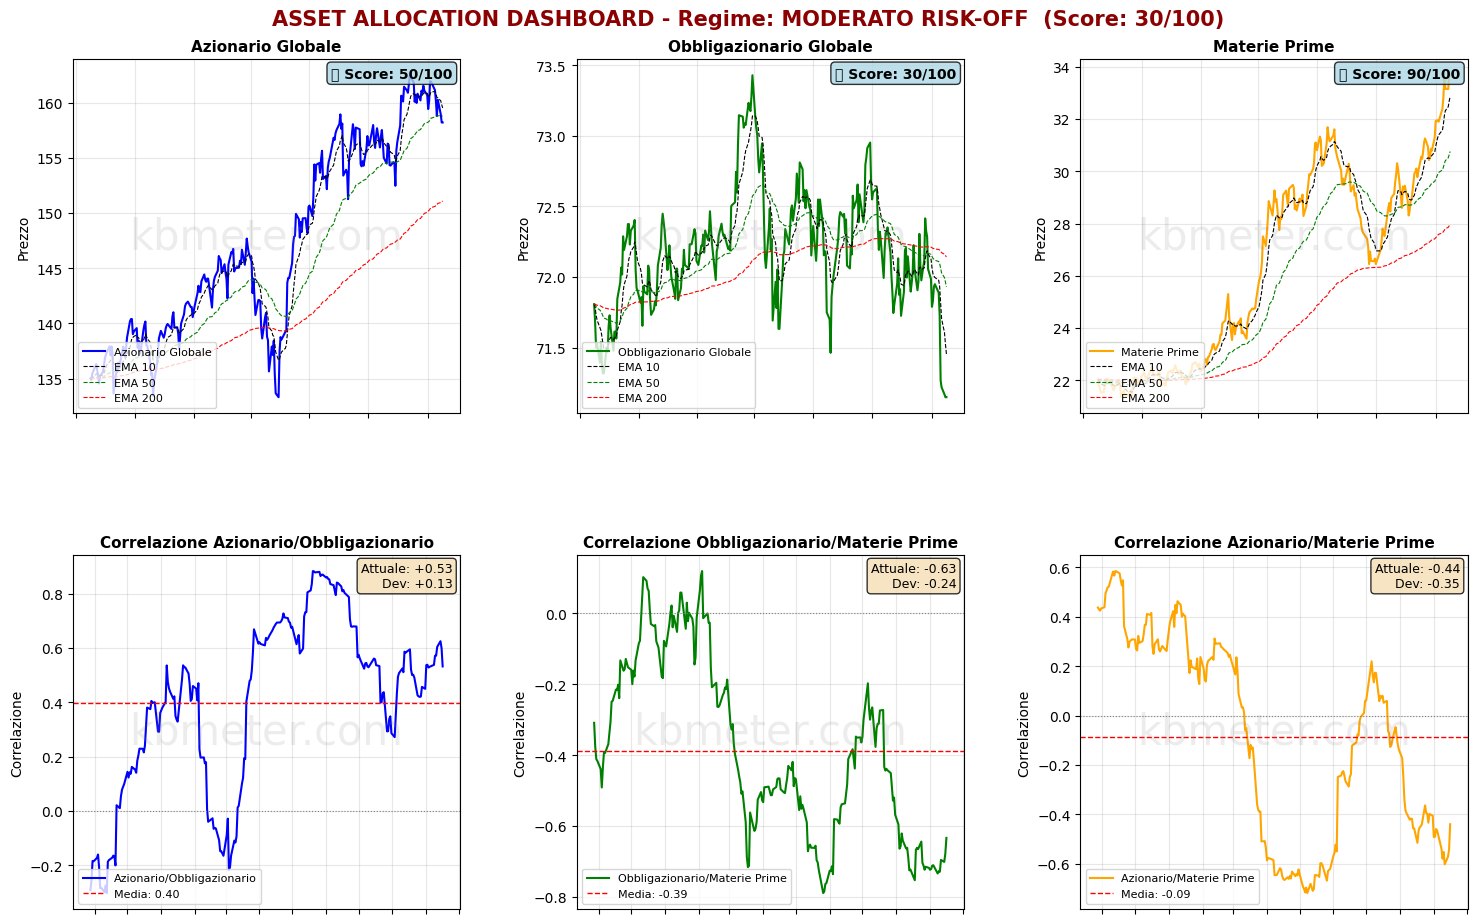
The asset-class picture shows a new development, which will obviously require confirmation. Global equities have broken below their medium-term moving-average support, putting the sideways trading phase of recent months at risk. Meanwhile, the bear phase in the bond market is confirmed, with all three moving averages inverted and the asset class remaining at one-year lows. Commodities, as mentioned, continue their upward trend, driven by the energy sector.
Our market “weather map” continues to show a slow but steady deterioration in equity scores. The global index stands at a score of 44, with the trend component at yearly lows, down more than 8 points since the beginning of the year and as much as 14 points over the past month. Gold and bonds remain in negative territory, while the dollar is the only asset class still above the 60-point threshold, supported by expectations of further rate hikes from the Fed.
Global Futures – Pre-Market Sentiment
Pre-Opening Futures: Global futures point to moderately risk-on sentiment (+0.07% on average), with the US slightly positive (+0.21%), Europe slightly negative (-0.02%), and Asia slightly negative (-0.22%).
📊 Global Futures – Pre-Opening Sentiment
- Taiwan: +0.79%
- Euro Stoxx 50: +0.32%
- US Tech 100: +0.24%
- CSI 300: -0.55%
- CAC 40: -0.24%
- FTSE MIB: -0.19%
Macroeconomic calendar
The key event of the day is, of course, the Fed’s interest-rate decision, with markets pricing in an 87%-92% probability of a 25-basis-point hike, taking the target range to 3.75%-4.00%. Among the other macroeconomic data releases to watch, we highlight Japan’s August 2026 export figures, UK inflation for August 2026 (an important input for tomorrow’s BoE decision), euro-area industrial production for July 2026, US retail sales for August 2026, US export prices for August, and the latest update on the average interest rate for 30-year US mortgages.
Already a subscriber? Login here
NOTES AND WARNINGS
Data compiled by kbmeter.com. Analysis date: 16 September 2026 - 10:08 AM GMT+1
This content is provided for informational purposes only and should not be considered financial advice. All scores and assessments are based on the previous trading day’s closing prices. Futures indications refer to the date and time of the analysis.
