US consumer confidence in May: an intermarket look
The latest consumer confidence surveys point to a more pessimistic outlook for the US economy, accompanied by rising inflation expectations. So let’s check the status of our intermarket consumer confidence indicator.
Comparing the Consumer Staples sector with the Consumer Discretionary sector is a good way to understand how investors are interpreting consumer attitudes in these sensitive months.
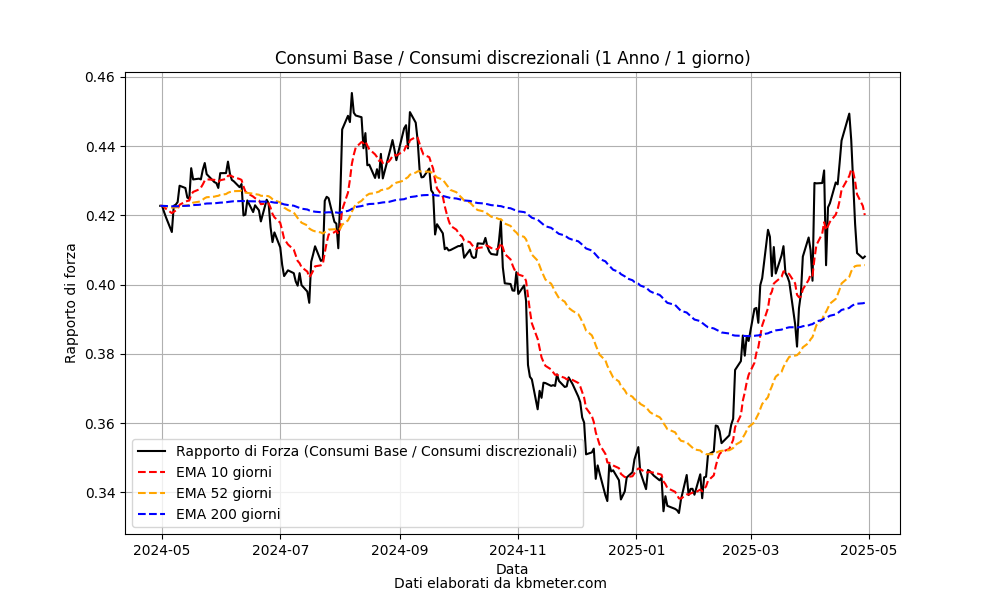
The first chart we propose, shown above, shows the evolution of the relative strength ratio between the two sectors of the S&P500. In the numerator we have basic consumption, which is needed even in times of uncertainty; in the denominator we have discretionary consumption, which is not needed and is favoured in times of confidence. The trend of the indicator is significant. We are observing the bullish trend that began in January, with two important technical signals: the upward crossing of the 50 and 200 day averages and the break of the 200 day average of the indicator. Note how the indicator has returned to its level of mid-2014, before the pre-election euphoria “kicked in”.
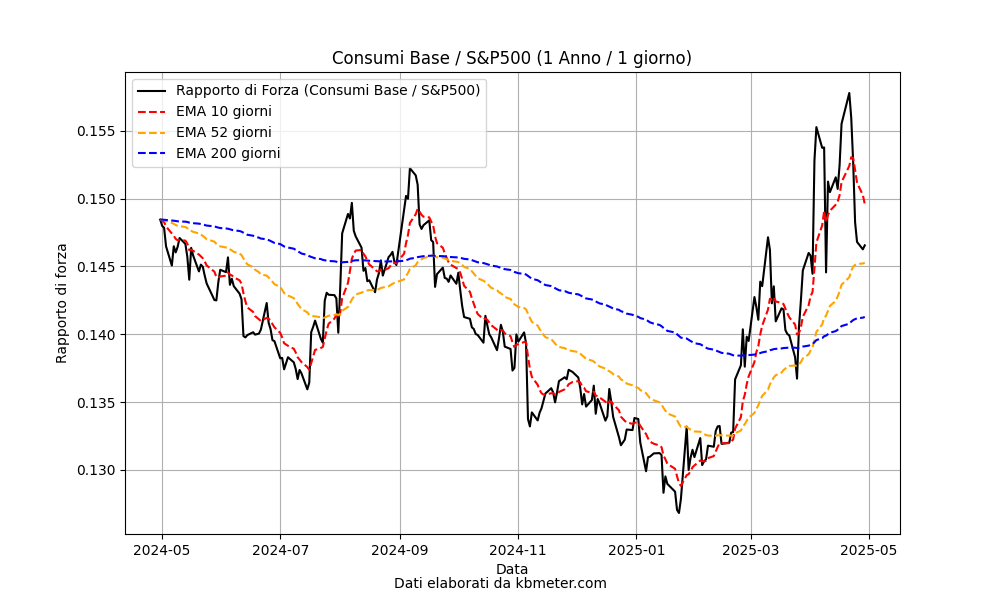
But the strength of the consumer staples sector is not limited to discretionary consumption. As we can see in the chart above, defensive consumption is outperforming the S&P500. The bullish trend that started in January is similar to the one above, with the same technical indicators.