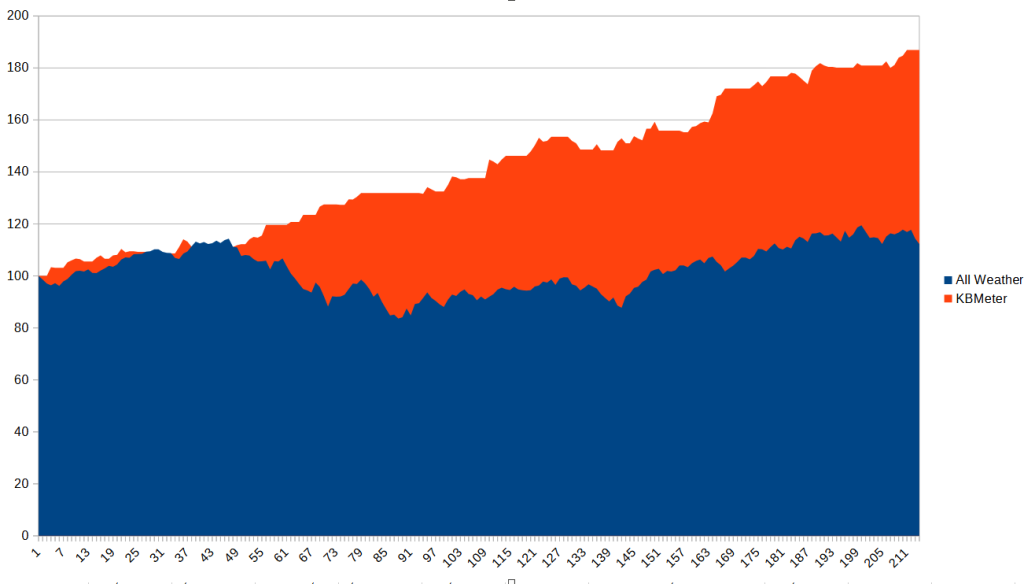
Simulation: All Weather vs. KBMeter Algorithm
All Weather is an investment strategy developed primarily by Ray Dalio and Bridgewater Associates in the 1990s. The objective of this strategy is to obtain a portfolio that minimises the risks arising from market fluctuations in all types of economic scenarios. Diversification between different assets and a balance made according to risk (risk parity) are the two main characteristics of All Weather.
We tried to compare the performance of this strategy with that derived from the analyses generated by our KbMeter algorithm. Our analysis system, based on Artificial Intelligence models, combines historical and forecast analyses to identify, on a weekly basis and if present, the financial instruments with the greatest potential within a given portfolio.
The simulation was carried out over 299 weeks, using ETFs listed on the New York Stock Exchange. The All Weather portfolio consists of 30% in US equities, 40% in long-term bonds, 15% in medium-term bonds, 7.5% in gold and 7.5% in commodities. Kb Meter’s algorithm returns for each week, when present, a buy signal for the best asset among those listed above.
ALL WEATHER
Annualised return: 8.29%.
Annualised volatility: 22.58%.
KB METER
Annualised return: 16.78%.
Annualised volatility: 7.07%.
The main difference between the two strategies is that while All Weather remains invested in all asset classes and is penalised in periods when riskier assets perform strongly, KBMeter’s analysis, being a forward-looking analysis, only takes into account the most promising asset classes and includes periods when no investment is made.
Beyond the numbers, we also found this comparison useful to show, on the one hand, how our algorithm works, and in particular its volatility control; and, on the other, to remind us how cash positions can have a considerable impact on portfolio returns and volatility, acting in turn as a diversifying element.
Disclaimer
The performance of the strategies illustrated on this site are derived from historical data tested retrospectively and do not represent actual investments or their results. Back-testing and historical performance do not indicate or guarantee future results. Therefore, it should not be assumed that the future performance of any strategy will be profitable or similar to corresponding levels of past performance, and it should be taken into account that any investment, including those made on the basis of any strategy, has the potential for loss. Retrospective results are based on certain assumptions regarding the market and our analysis of past performance, including, but not limited to, the assumption that an investor would be able to purchase the securities selected by the model and that market liquidity is constant. Deviations from these assumptions may materially affect retrospective returns. We make no warranty as to the assumptions made in the model, including, without limitation, that such assumptions are reasonable, sufficient or correct. Our back-testing models are based on data from third-party data providers and we do not warrant that such information is accurate or complete. Furthermore, these data, formed retrospectively, do not take into account actual trading influences or unforeseen economic and market events. Furthermore, as these are not actual transactions, the results may not take into account certain market factors and may not reflect the potential impact of various economic conditions.