
October 2026: Improving Scores Mask a Deeply Divided Market
The average health score rose to 50.6 from 46.8 in September. The share of assets scoring above 55, the threshold indicating favourable conditions, increased from 22.0% to 37.1%, equivalent to 49 assets. There are 43 assets below 45, representing 32.6% of the total. No asset scores above 70 or below 35.
Trend and momentum told two different stories. Trend reflects price direction over the medium to long term and is positive for 57.6% of assets, compared with 36.4% showing a negative trend. Momentum measures the speed of recent price movements on a scale ranging from -100 to +100. Its average reading stands at -2.4, recovering from approximately -18 in September. However, this average masks a sharply divided distribution. A total of 47 assets have momentum below -30, while 31 are above +30, and only 14 remain in the neutral range between -10 and +10.
…
🔒 Subscriber-only content. Activate 14-day free trial or Login here
The long-term technical picture delivered a less encouraging signal than the average score. The share of assets trading above their 200-day moving average, which represents the average price over the past 200 days and serves as a benchmark for the long-term trend, fell to 46.2% from 50.8% in September. Meanwhile, 39.4% of assets are trading above their 50-day moving average. The average Relative Strength Index (RSI) increased to 46.8 from 42.2. This indicator compares recent gains and losses on a scale of 0 to 100, with readings below 30 indicating oversold conditions, meaning that an asset has declined sharply over a short period. A total of 22 assets are currently oversold, while 9 are overbought, with readings above 70.
Bonds were the standout performers of the month. Following a weak September, bond prices rebounded and yields declined. The 10-year US Treasury yield fell from 5.29% on September 30 to 4.94% on October 30, after reaching a monthly high of 5.31% on October 5. The 30-year yield declined from 5.64% to 5.31%, while the 2-year yield dropped from 4.88% to 4.56%. The ETF tracking US Treasuries with maturities of more than 20 years gained 5.2%.
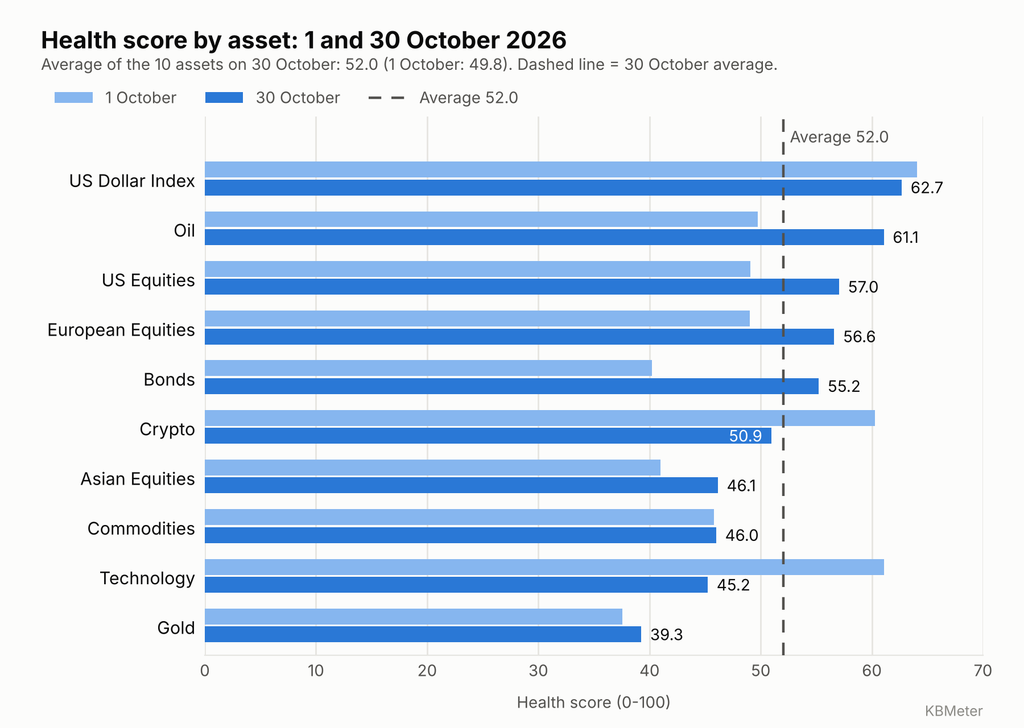
Within our system, US bonds reached an average health score of 56.2, up 15.9 points in one month, with 81.8% of assets in the category scoring above 55. Europe followed a similar trajectory, with an average health score of 56.6, up 11.8 points, and 71.4% of assets above 55. The strongest improvement was recorded by US Treasury Inflation-Protected Securities (TIPS), which gained 21.0 points to reach 57.3. They were followed by 7–10-year Treasuries, up 20.7 points to 58.8, and zero-coupon Treasuries, which gained 19.9 points to 55.3.
The decline in yields was concentrated in just a handful of trading sessions. On October 15, the 10-year yield fell by 9 basis points, from 5.19% to 5.10%. On October 22, it dropped by 17 basis points, from 5.13% to 4.96%, during the same session in which the S&P 500 fell 1.2% following Meta and Tesla’s earnings releases. Central banks kept interest rates unchanged. On October 28, the Federal Reserve maintained its target range at 3.75%–4.00%, with two members favouring a rate hike, while the ECB left rates unchanged on October 29. The recovery remains incomplete. Only 1 out of 11 US bond assets is trading above its 200-day moving average, compared with 2 out of 7 in Europe.
Falling yields failed to support gold. The gold-tracking ETF lost 6.6% during the month, while the silver ETF declined by 18.2%. The precious metals category has an average health score of 38.9, with no assets scoring above 55, none trading above their 200-day moving average, and the lowest average momentum in the entire system, at -42.2. Palladium is among the most oversold assets, with an RSI of 21.0. Gold fell 2.6% on October 22, during the session in which yields dropped by 17 basis points. It then declined by a further 3.5% on October 30, when the S&P 500 lost 1.8%. On both occasions, gold failed to perform its traditional safe-haven role.
The US dollar ended the month close to where it started. The US Dollar Index rose from 101.45 to 101.88, gaining 0.4%. However, its momentum score fell from +43.9 to -12.8, a decline of 56.7 points. Within the currencies category, the average health score stands at 50.7, down 1.7 points. The US dollar/Chinese yuan exchange rate has the lowest RSI in the entire system, at 11.1, and a health score of 37.3.
Cryptocurrencies recorded the sharpest deterioration among the 14 categories. The average health score fell by 13.8 points to 45.3, while average momentum dropped to -32.6, down 50 points in one month. None of the five cryptocurrencies scores above 55. Dogecoin recorded a 19.8-point decline in its health score, followed by Ripple, down 18.5 points, and Bitcoin, down 15.5 points. Prices followed the same downward trajectory. Bitcoin fell 7.6%, from $83,554 to $77,198, while Ripple declined by 15.7% and Dogecoin by 19.7%. Bitcoin had reached $87,146 on October 2 before losing 4.3% in a single trading session on October 29. Three out of five cryptocurrencies remain above their 200-day moving average.
Cryptocurrencies and equities were connected by the same underlying dynamic. Risk appetite shifted direction, moving away from cryptocurrencies and technology stocks towards defensive sectors and financials. In the United States, the S&P 500 closed at 7,580 points, down 0.9% for the month. On October 30, it fell 1.8%, following its October 6 closing high of 7,819. However, this headline figure conceals a broad sector rotation. The Nasdaq Composite lost 5.3%, while the Nasdaq-100 ETF declined by 6.7%. The technology sector fell 8.3% and semiconductors dropped 14.2%. By contrast, consumer staples gained 10.9%, utilities rose 10.1%, and financials advanced 5.8%.
Within the health score framework, financials gained 25.2 points to reach 67.7, the highest reading in the entire system. Consumer staples rose 24.9 points to 63.7, while utilities gained 21.6 points to 59.7. Technology declined by 14.7 points to 46.4, and semiconductors fell 17.0 points to 44.5. Communication services recorded the lowest health score in the system, at 36.0. The US equity market retains a sound long-term technical structure, with 7 out of 8 assets still trading above their 200-day moving average. However, average momentum across the category stands at -16.5.
Europe displayed a stronger underlying structure. European equity markets have an average health score of 55.5, up 6.7 points, while 80% of assets, or 12 out of 15, are trading above their 200-day moving average. Among the five major European stock markets, Frankfurt gained 2.5%, while Paris was broadly unchanged, up 0.1%. Madrid fell 4.0% and Milan declined 3.6%, from 51,372 to 49,500 points. London reached 10,840 points midway through the month and was trading at approximately 10,690 on October 27. Among eurozone sectors, food and beverages recorded a 20.9-point increase in their health score to 66.0, while insurance stands at 64.0. European technology stocks experienced a sharp reversal in momentum, which fell from +39.2 to -18.6.
Asia has an average health score of 45.9, up 5.0 points. Only one asset out of 11 scores above 55: Australia, at 61.2. China has a health score of 37.4 and an RSI of 22.1. Turkey is also in oversold territory, with an RSI of 21.1. Latin America has an average health score of 43.3, with no assets scoring above 55 and none trading above their 200-day moving average.
Among commodities, energy led the gains. The energy ETF has a health score of 63.8, the fifth-highest reading in the entire system. Brent crude closed at $113.17 per barrel on October 30, gaining 2.1% during the session amid renewed concerns over the Middle East. The ETF tracking Brent crude gained 18.8% over the month. Brent’s RSI stands at 70.2, just above the overbought threshold.
The rest of the commodity complex lost ground. The 24 commodities have an average health score of 46.6, average momentum of -22.5, and only 4 assets scoring above 55. The steepest declines were recorded in the agricultural and livestock segments. Orange juice lost 16.4 points in its health score, falling to 38.5. Lean hogs stand at 36.0, the second-lowest reading in the system, while the livestock ETF is at 36.3. Corn has a health score of 38.5, and the agriculture ETF has an RSI of 22.5. Platinum, at 37.5, is also among the weakest readings in the system.
[/preview]