Government and Corporate Bonds: Is the Sentiment Signal Changing?
The comparison between government and corporate bonds is a powerful tool for understanding what’s happening in the markets from an intermarket perspective—that is, by observing the relationships between different asset classes. In particular, this ratio offers valuable insight into investor sentiment and risk perception.
When government bonds begin to outperform corporate bonds, it’s usually a sign that investors are becoming more cautious. They seek the relative safety of sovereign debt in response to economic uncertainty, potential financial crises, or geopolitical tensions. This dynamic is a classic example of a “flight to quality“, and it tends to widen the spread between sovereign and corporate bonds. Corporate debt is perceived as riskier and therefore less attractive. This typically corresponds to a risk-off phase in the markets, often accompanied by increased volatility and downward pressure on equities—especially in the more cyclical sectors.
Conversely, when corporate bonds outperform government bonds, the signal is quite different: investors are more willing to take on risk in pursuit of higher returns. This usually occurs in a context of growing confidence in the economic outlook, perhaps supported by accommodative monetary policy or signs of recovery. Credit spreads tend to tighten, equity markets generally benefit, and the overall mood shifts to one of optimism—a risk-on phase.
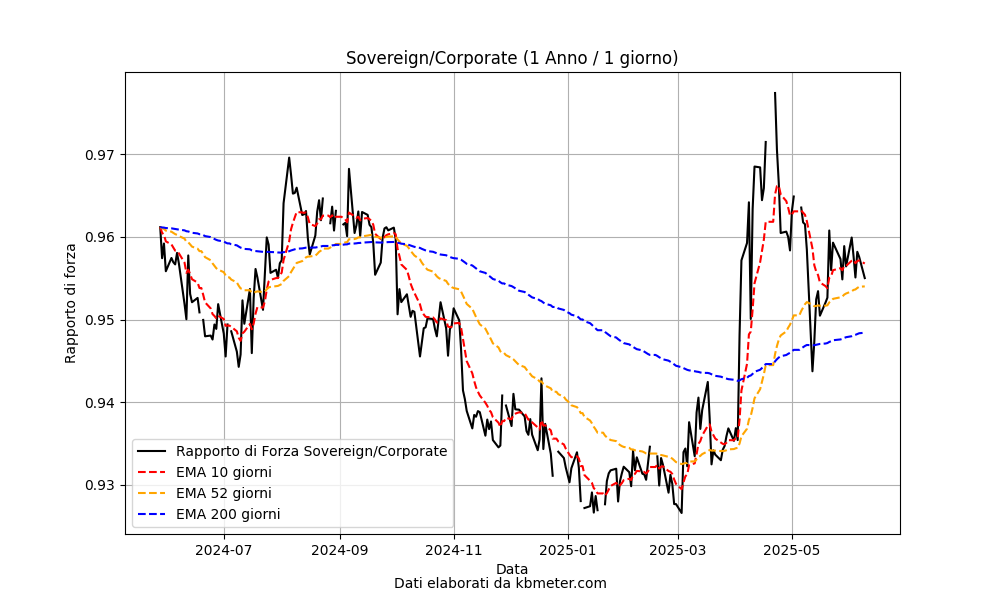
The chart above shows how the relative strength between global investment-grade government bonds and global corporate bonds has evolved over the past year. For this analysis, we used two USD-denominated ETFs to track their performance.
We can clearly observe the strong risk-on phase that supported markets until the beginning of 2025. This was followed by a trend reversal, driven by rising international tensions. Now, as of May 2025, we are witnessing a potential new shift, with tentative signs of a return to risk-on sentiment—though not yet confirmed. Should the indicator break below the 200-day moving average in the coming weeks, it would offer an interesting signal to help gauge what to expect from equity markets in the second half of 2025.