Week ends under Middle East tensions; markets jittery, fragile hope remains
Financial markets are heading toward the close of another week marked by uncertainty and volatility. Investors are looking with hope at Trump’s decision to further delay the resumption of attacks on Iran by U.S. armed forces. The most optimistic interpretation sees this decision as a sign of emerging dialogue between the parties, with potential developments as early as the weekend.
Meanwhile, sentiment remains between neutral and moderately negative, with the main risk indicators compressed in weak zones, while global equities and bonds remain in the support area of the long-term moving average. Futures points to a moderately positive opening for both Europe and the United States.
Market Weather Map
March 27, 2026
US Equities
Eu Equities
Asia Equities
Commodities
Bonds
Dollar Index
Technology
Gold
Oil
Crypto
Market Summary
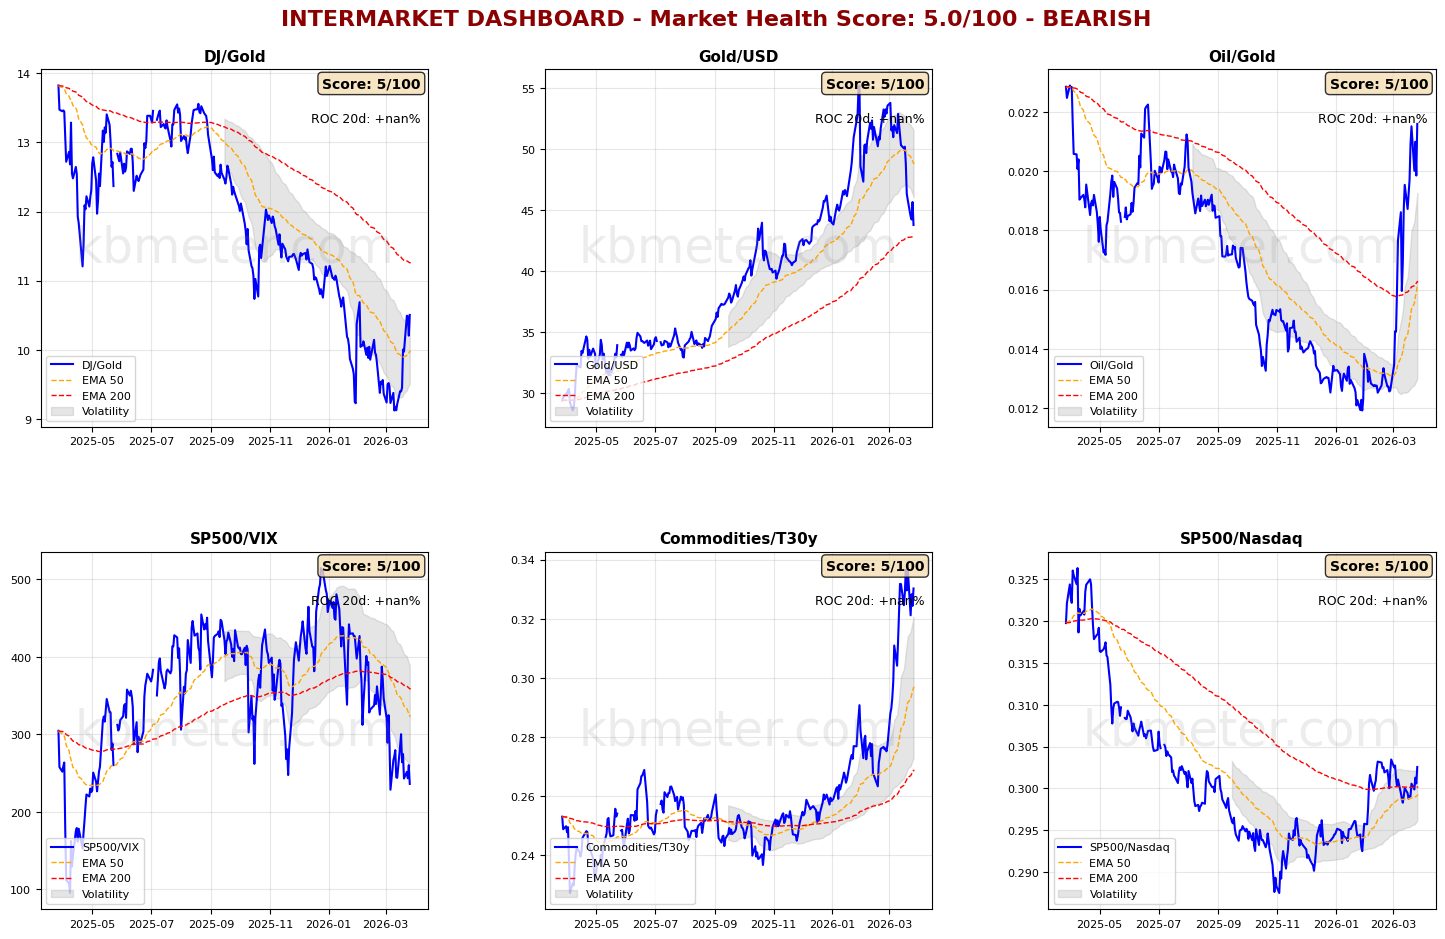
Financial markets today show a moderately negative sentiment. Intermarket analysis highlights a Market Health Score of 5/100 (negative). Overall, our intermarket dashboards provide largely stable indications, continuing to signal a compression phase for risk indicators.
More interesting, and worth monitoring, is the situation across asset classes. Equities and bonds continue to test the support zone near the long-term moving average, while a clear short-term downtrend is visible in both charts. The correlation between stocks and bonds is becoming increasingly positive, while commodities are losing momentum due to weaker support from gold and oil.
Our “weather map” still shows no assets above the 50-point threshold, while a more pronounced downward direction for bonds is confirmed.
Pre-Opening Futures: Global futures indicate a moderate risk-on sentiment (average +0.24%), with the U.S. positive (+0.61%), Europe slightly positive (+0.04%), and Asia slightly positive (+0.36%).
📊 Global Futures – Pre-Market Sentiment
- Nikkei 225 derived: +1.46%
- Russell 2000: +0.88%
- Hang Seng derived: +0.81%
- IBEX 35 derived: -1.23%
- CSI 300: -1.19%
- TecDAX derived: -0.91%
📄 Detailed Intermarket Analysis
INTERMARKET ANALYSIS - 2026-03-27
============================================================

MARKET HEALTH SCORE: 5.0/100
SENTIMENT: BEARISH

============================================================
MAIN RELATIONSHIPS SUMMARY
============================================================


DJ/Gold:
  - Component score: 5.0/100
  - Current value: nan
  - Position vs EMA50: BELOW
  - 20-day ROC: +nan%
  - 50-day ROC: +nan%
  → Flight to safe haven

Gold/USD:
  - Component score: 5.0/100
  - Current value: nan
  - Position vs EMA50: BELOW
  - 20-day ROC: +nan%
  - 50-day ROC: +nan%

Oil/Gold:
  - Component score: 5.0/100
  - Current value: nan
  - Position vs EMA50: BELOW
  - 20-day ROC: +nan%
  - 50-day ROC: +nan%
  → Declining energy demand

SP500/VIX:
  - Component score: 5.0/100
  - Current value: nan
  - Position vs EMA50: BELOW
  - 20-day ROC: +nan%
  - 50-day ROC: +nan%

Commodities/T30y:
  - Component score: 5.0/100
  - Current value: nan
  - Position vs EMA50: BELOW
  - 20-day ROC: +nan%
  - 50-day ROC: +nan%
  → Slowdown expectations

SP500/Nasdaq:
  - Component score: 5.0/100
  - Current value: nan
  - Position vs EMA50: BELOW
  - 20-day ROC: +nan%
  - 50-day ROC: +nan%

============================================================
CONCLUSIONS AND RECOMMENDATIONS
============================================================

The market is in bearish territory. Signs of widespread stress.
Risk-off move underway. Maximum caution.
Positioning: VERY DEFENSIVE, capital preservation.


STRONGEST RELATIONSHIPS:
  • DJ/Gold: 5.0/100
  • Gold/USD: 5.0/100
  • Oil/Gold: 5.0/100

WEAKEST RELATIONSHIPS:
  • SP500/VIX: 5.0/100
  • Commodities/T30y: 5.0/100
  • SP500/Nasdaq: 5.0/100

============================================================
Analysis automatically generated by kbmeter.com
Date: 2026-03-27
📄 Detailed Asset Allocation Analysis
ASSET ALLOCATION & REGIME ANALYSIS - 2026-03-27
======================================================================
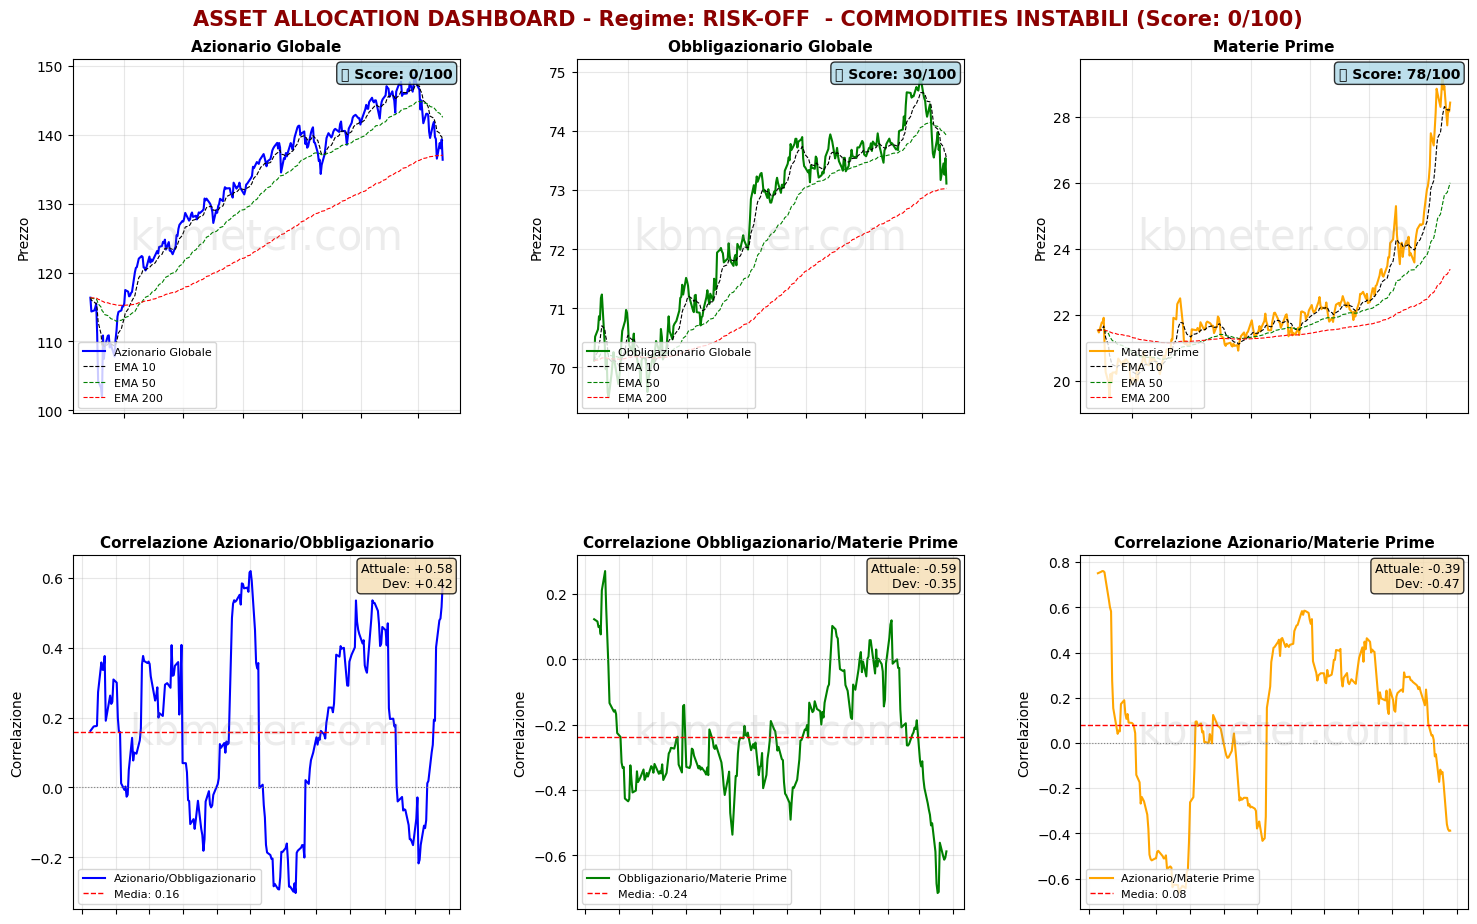
MARKET REGIME: RISK-OFF - UNSTABLE COMMODITIES
REGIME SCORE: 0.0/100
======================================================================
TREND AND VOLATILITY ANALYSIS
======================================================================
GLOBAL EQUITIES (ACWI):
Short-Term Trend (5d): -0.12% | BELOW EMA 10
Medium-Term Trend (20d): -7.46% | BELOW EMA 50
Long-Term Trend (60d): -4.23% | BELOW EMA 200
5d Volatility: 27.2%
20d Volatility: 18.6%
60d Volatility: 14.8%
COMMODITIES (DBC):
Medium-Term Trend (20d): +13.31% | ABOVE EMA 50
20d Volatility: 28.9%
ACWI/BND Correlation (30d): 0.582
REGIME INTERPRETATION:
The market is in a risk-off regime. Negative trends across multiple horizons and/or high volatility.
Flight to safe assets.
Suggested positioning: DEFENSIVE, capital protection.
⚠️ COMMODITIES ALERT: Commodities are showing high volatility. This may
indicate uncertainty about economic growth or unstable supply/demand dynamics.
======================================================================
ASSET RANKING - WHO IS PERFORMING BEST?
======================================================================
🥇 1. Commodities (DBC) - SCORE: 78/100
Price: $28.44
Trend: ABOVE EMA10 | ABOVE EMA50 | ABOVE EMA200
Performance: 5d -1.73% | 20d +13.31% | 60d +25.62%
Volatility: 5d 36.2% | 20d 28.9% | 60d 24.5%
Drawdown: -2.84%
→ Asset in STRONG HEALTH: positive trends and controlled volatility
🥈 2. Global Bonds (BND) - SCORE: 30/100
Price: $73.11
Trend: BELOW EMA10 | BELOW EMA50 | ABOVE EMA200
Performance: 5d -0.08% | 20d -2.44% | 60d -0.94%
Volatility: 5d 8.6% | 20d 5.5% | 60d 4.0%
Drawdown: -2.44%
→ Asset in WEAK conditions: negative trends or elevated volatility
🥉 3. Global Equities (ACWI) - SCORE: 0/100
Price: $136.38
Trend: BELOW EMA10 | BELOW EMA50 | BELOW EMA200
Performance: 5d -0.12% | 20d -7.46% | 60d -4.23%
Volatility: 5d 27.2% | 20d 18.6% | 60d 14.8%
Drawdown: -8.25%
→ Asset in DISTRESS: avoid or significantly underweight
======================================================================
CORRELATION ANALYSIS - CURRENT vs HISTORICAL
======================================================================
ACWI/BND:
Current correlation (30d): +0.582
Historical average (1 year): +0.159
Deviation: +0.424
⚠️ SIGNIFICANT DEVIATION from historical average
→ Positive correlation: diversification COMPROMISED
BND/DBC:
Current correlation (30d): -0.588
Historical average (1 year): -0.237
Deviation: -0.351
⚠️ SIGNIFICANT DEVIATION from historical average
ACWI/DBC:
Current correlation (30d): -0.388
Historical average (1 year): +0.080
Deviation: -0.468
⚠️ SIGNIFICANT DEVIATION from historical average
→ Negative correlation: possible supply-driven shift
======================================================================
OPERATIONAL SUMMARY
======================================================================
STRONGEST ASSET: Commodities (Score: 78/100)
WEAKEST ASSET: Global Equities (Score: 0/100)
SUGGESTED ACTION: Reduce exposure to the weakest asset, favor defensive assets.
DIVERSIFICATION: GOOD - Diversification benefits present.
======================================================================
Analysis automatically generated by kbmeter.com
Date: 2026-03-27
On the macro front, today’s agenda includes February retail sales data for the United Kingdom and March inflation in Spain. Particularly noteworthy will be the readings of the Eurozone inflation expectations survey (even if referring to February) and the final release of the University of Michigan Consumer Sentiment Index for March 2026.
Already a subscriber? Login here
NOTES AND WARNINGS
Data compiled by kbmeter.com. Analysis date: 27 March 2026 - 7:32 AM GMT+1
This content is provided for informational purposes only and should not be considered financial advice. All scores and assessments are based on the previous trading day’s closing prices. Futures indications refer to the date and time of the analysis.