U.S. Jobs Data Lift Wall Street, but Financial Markets Remain Uncertain
U.S. labor market data are giving Wall Street a positive session, but overall sentiment in financial markets remains neutral and investors, awaiting U.S. inflation data (due tomorrow), continue to show limited directional conviction in their decisions. This morning, futures indicate a broadly uncertain opening for Europe and a positive one for Wall Street.
Market Weather Map
February 12, 2026
US Equities
Eu Equities
Asia Equities
Commodities
Bonds
Dollar Index
Technology
Gold
Oil
Crypto
Market Summary
How to interpret our financial indicators? Find out here.
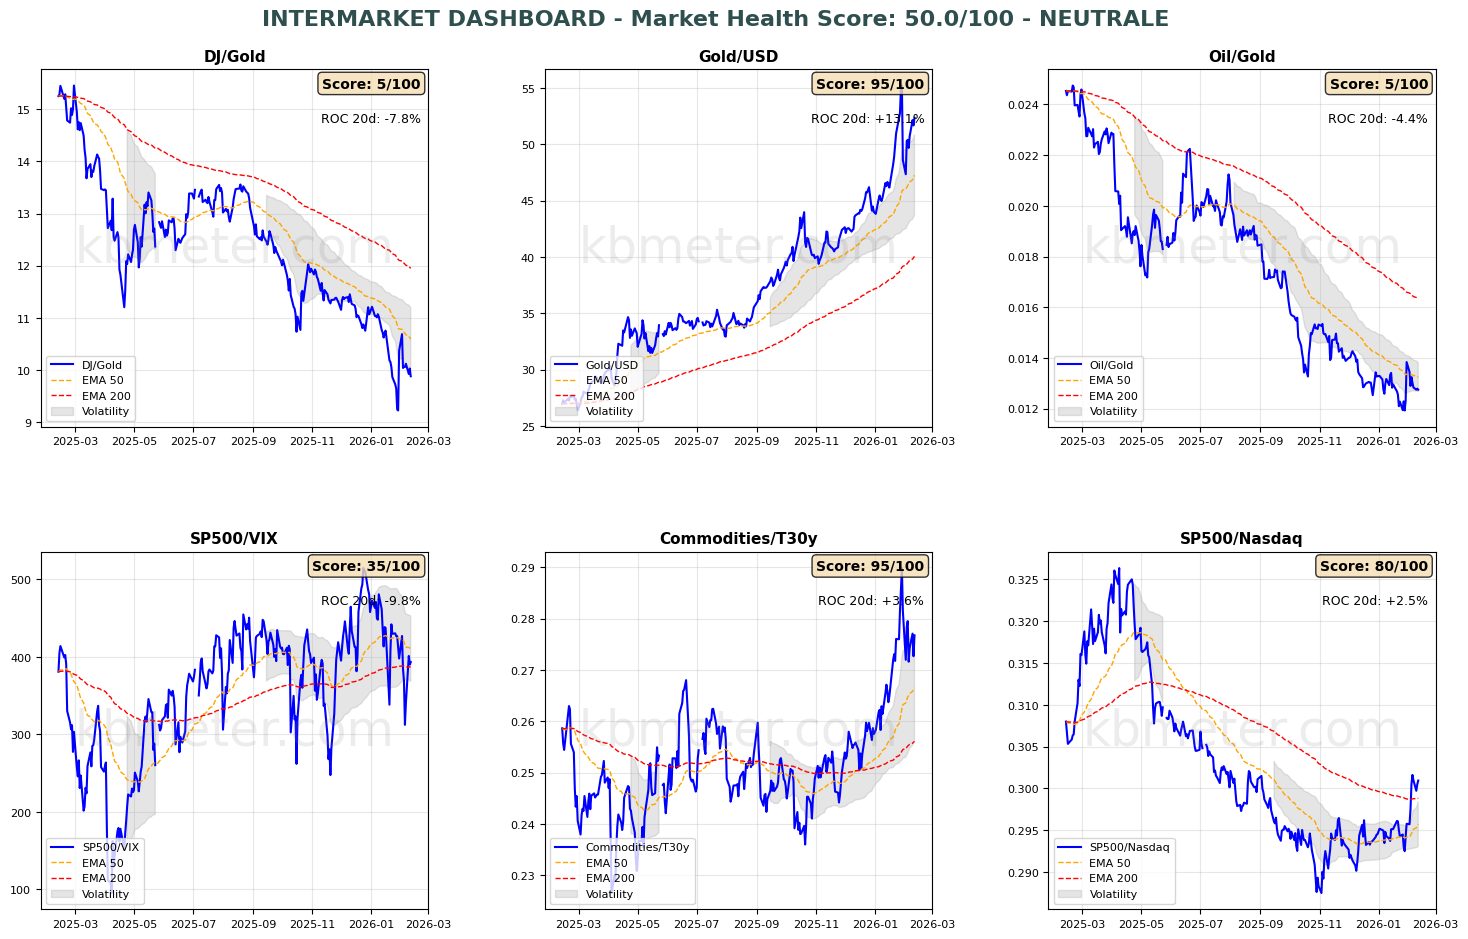
Financial markets today display a neutral/slightly positive sentiment. Intermarket analysis highlights a Market Health Score of 50/100 (neutral). Looking at our intermarket dashboards, we are still unable to identify a clearly positive turning point regarding risk-on positioning. The S&P 500/VIX ratio, highly volatile, maintains a short-term bearish bias and is once again testing the support of its long-term moving average. Weakness in the technology sector continues, while gold remains broadly stable.
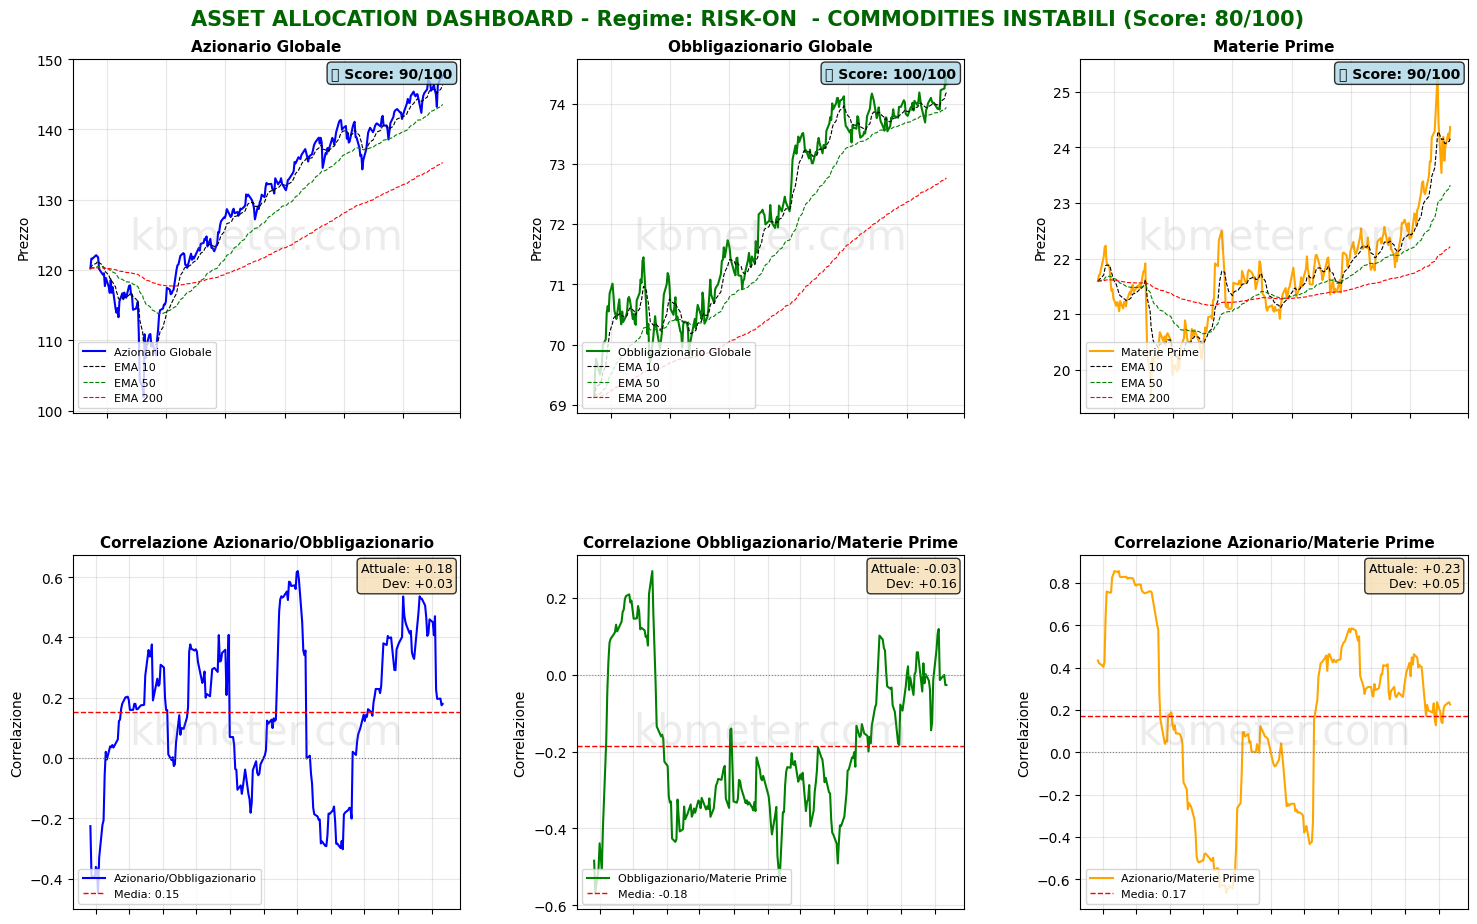
At the same time, the three main asset classes show no signs of deterioration in their medium-term trends. Correlations remain close to zero, making the current environment favorable for diversification.
Pre-Market Futures: Global futures point to a moderate risk-off sentiment (-0.03% on average), with the U.S. slightly positive (+0.31%), Europe slightly negative (-0.05%), and Asia slightly negative (-0.46%).
📊 Global Futures – Pre-Market Sentiment
- Euro Stoxx 50 derived: +0.74%
- Russell 2000: +0.47%
- DAX derived: +0.40%
- TecDAX derived: -0.84%
- Hang Seng derived: -0.66%
- FTSE MIB derived: -0.63%
📄 Detailed Intermarket Analysis
INTERMARKET ANALYSIS - 2026-02-12
============================================================

MARKET HEALTH SCORE: 50.0/100
SENTIMENT: NEUTRAL

============================================================
SUMMARY OF MAIN RATIOS
============================================================


DJ/Gold:
  - Component score: 5.0/100
  - Current value: 9.8828
  - Position vs EMA50: BELOW
  - 20-day ROC: -7.80%
  - 50-day ROC: -12.63%
  → Flight to safe haven

Gold/USD:
  - Component score: 95.0/100
  - Current value: 52.3763
  - Position vs EMA50: ABOVE
  - 20-day ROC: +13.14%
  - 50-day ROC: +23.49%

Oil/Gold:
  - Component score: 5.0/100
  - Current value: 0.0127
  - Position vs EMA50: BELOW
  - 20-day ROC: -4.36%
  - 50-day ROC: -8.19%
  → Declining energy demand

SP500/VIX:
  - Component score: 35.0/100
  - Current value: 393.2844
  - Position vs EMA50: BELOW
  - 20-day ROC: -9.75%
  - 50-day ROC: -6.12%
  → Contracting risk appetite

Commodities/T30y:
  - Component score: 95.0/100
  - Current value: 0.2767
  - Position vs EMA50: ABOVE
  - 20-day ROC: +3.60%
  - 50-day ROC: +10.65%
  → Economic growth expectations

SP500/Nasdaq:
  - Component score: 80.0/100
  - Current value: 0.3009
  - Position vs EMA50: ABOVE
  - 20-day ROC: +2.46%
  - 50-day ROC: +2.66%
  - ⚠️ ANOMALY DETECTED - Significant deviation from the mean

============================================================
CONCLUSIONS AND RECOMMENDATIONS
============================================================

The market is in a neutral/sideways phase. Mixed signals across the various ratios.
There is no clear directional bias. Wait for confirmation.
Positioning: BALANCED, avoid excess exposure.


STRONGEST RATIOS:
  • Gold/USD: 95.0/100
  • Commodities/T30y: 95.0/100
  • SP500/Nasdaq: 80.0/100

WEAKEST RATIOS:
  • SP500/VIX: 35.0/100
  • DJ/Gold: 5.0/100
  • Oil/Gold: 5.0/100

============================================================
Analysis automatically generated by kbmeter.com
Date: 2026-02-12
📄 Detailed Asset Allocation Analysis
ASSET ALLOCATION & REGIME ANALYSIS - 2026-02-12
======================================================================

MARKET REGIME: RISK-ON - UNSTABLE COMMODITIES
REGIME SCORE: 80.0/100

======================================================================
TREND AND VOLATILITY ANALYSIS
======================================================================

GLOBAL EQUITIES (ACWI):
  Short-Term Trend (5d): +3.14% | ABOVE EMA 10
  Medium-Term Trend (20d): +2.07% | ABOVE EMA 50
  Long-Term Trend (60d): +6.37% | ABOVE EMA 200

  5d Volatility: 19.5%
  20d Volatility: 13.7%
  60d Volatility: 11.3%

COMMODITIES (DBC):
  Medium-Term Trend (20d): +4.19% | ABOVE EMA 50
  20d Volatility: 25.9%

ACWI/BND Correlation (30d): 0.180

REGIME INTERPRETATION:
The market is in a risk-on regime. Equities show positive trends across multiple
time horizons and volatility remains contained. Investors are favoring risk assets.
Suggested positioning: OVERWEIGHT equities.

⚠️ COMMODITIES ALERT: Commodities are showing elevated volatility. This may
indicate uncertainty about economic growth or unstable supply/demand dynamics.

======================================================================
ASSET RANKING - TOP PERFORMERS
======================================================================

🥇 1. Global Bonds (BND) - SCORE: 100/100
     Price: $74.32
     Trend: ABOVE EMA10 | ABOVE EMA50 | ABOVE EMA200
     Performance: 5d +0.13% | 20d +0.18% | 60d +1.21%
     Volatility: 5d 4.0% | 20d 3.0% | 60d 2.7%
     Drawdown: -0.20%
     → Asset in STRONG HEALTH: positive trends and controlled volatility

🥈 2. Global Equities (ACWI) - SCORE: 90/100
     Price: $147.71
     Trend: ABOVE EMA10 | ABOVE EMA50 | ABOVE EMA200
     Performance: 5d +3.14% | 20d +2.07% | 60d +6.37%
     Volatility: 5d 19.5% | 20d 13.7% | 60d 11.3%
     Drawdown: 0.00%
     → Asset in STRONG HEALTH: positive trends and controlled volatility

🥉 3. Commodities (DBC) - SCORE: 90/100
     Price: $24.37
     Trend: ABOVE EMA10 | ABOVE EMA50 | ABOVE EMA200
     Performance: 5d +2.57% | 20d +4.19% | 60d +9.67%
     Volatility: 5d 19.9% | 20d 25.9% | 60d 18.2%
     Drawdown: -3.68%
     → Asset in STRONG HEALTH: positive trends and controlled volatility

======================================================================
CORRELATION ANALYSIS - CURRENT vs HISTORICAL
======================================================================

ACWI/BND:
  Current correlation (30d): +0.180
  Historical average (1 year): +0.151
  Deviation: +0.028
  → Weak correlation: moderate diversification

BND/DBC:
  Current correlation (30d): -0.026
  Historical average (1 year): -0.185
  Deviation: +0.158

ACWI/DBC:
  Current correlation (30d): +0.226
  Historical average (1 year): +0.173
  Deviation: +0.053

======================================================================
OPERATIONAL SUMMARY
======================================================================

STRONGEST ASSET: Global Bonds (Score: 100/100)
WEAKEST ASSET: Commodities (Score: 90/100)

SUGGESTED ACTION: Favor the strongest asset, maintain risk exposure.
DIVERSIFICATION: EXCELLENT - Asset classes are moving independently.

======================================================================
Analysis automatically generated by kbmeter.com
Date: 2026-02-12
On the macroeconomic front, today’s agenda includes U.K. economic data for the last quarter of 2025, India’s inflation for January 2026, the update on U.S. unemployment claims, and existing home sales for January 2026 in the United States.
As for earnings, results from major European companies will be released today: Siemens, Mercedes, and Hermès. Investors are also watching Unilever, Airbnb, and SoftBank.
Already a subscriber? Login here
NOTES AND WARNINGS
Analysis automatically generated by kbmeter.com. Analysis date: 12 February 2026 - 7:44 AM GMT+1
This content is provided for informational purposes only and should not be considered financial advice. All scores and assessments are based on the previous trading day’s closing prices. Futures indications refer to the date and time of the analysis.