
Tech Stocks Remain Under Pressure Ahead of Nvidia Earnings; Sentiment Weakens as Volatility Stays Elevated
The technology sector remains at the centre of attention across financial markets, with investors awaiting Nvidia’s earnings results (due this evening), while US trade policy decisions continue to weigh on the Asian technology sector. Geopolitical tensions remain elevated, but oil prices continue to trade weakly amid forecasts of an oversupply in 2027, recently reiterated by several sources. Market sentiment remains subdued and volatility continues to be high. Both global equities and commodities are facing a technically fragile situation. Futures point to a slightly negative opening in the US and a weaker start in Europe.
Market Weather Map
November 17, 2026
US Equities
Eu Equities
Asia Equities
Commodities
Bonds
Dollar Index
Technology
Gold
Oil
Crypto
Market Summary
Do you want to see the score details for all assets monitored by KBMeter?
Try free for 14 days →Financial markets sentiment
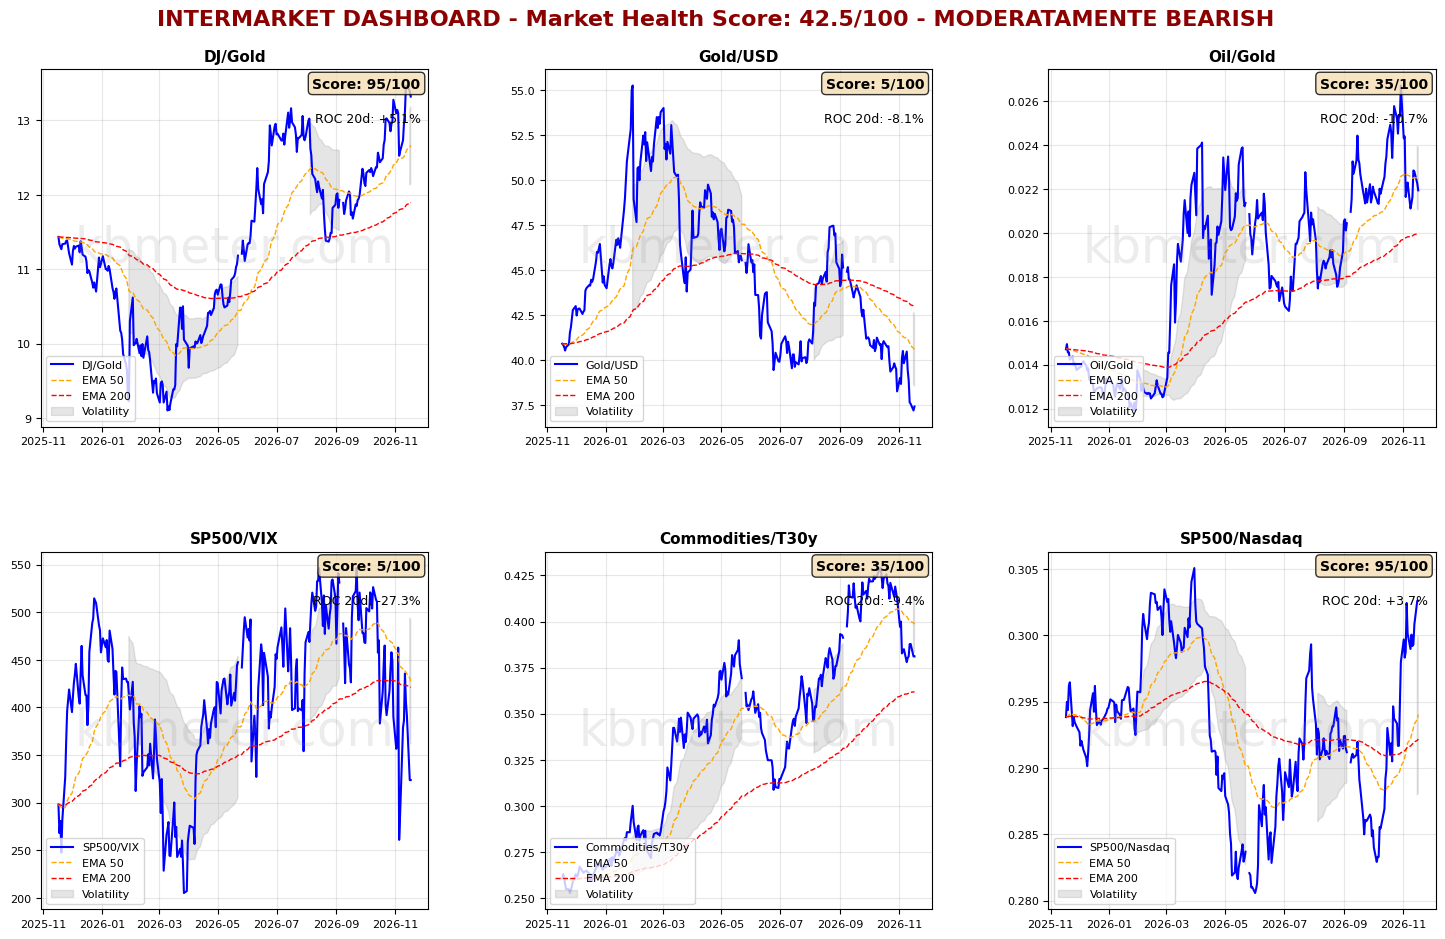
Financial markets are currently showing a neutral to moderately negative sentiment. Intermarket analysis indicates a Market Health Score of 42/100. Risk appetite remains limited across markets. The S&P 500/VIX ratio continues to trade below its long-term moving average, while its medium-term moving average is approaching it. The S&P 500/Nasdaq ratio remains near its highest levels since last May. In both cases, volatility remains elevated.
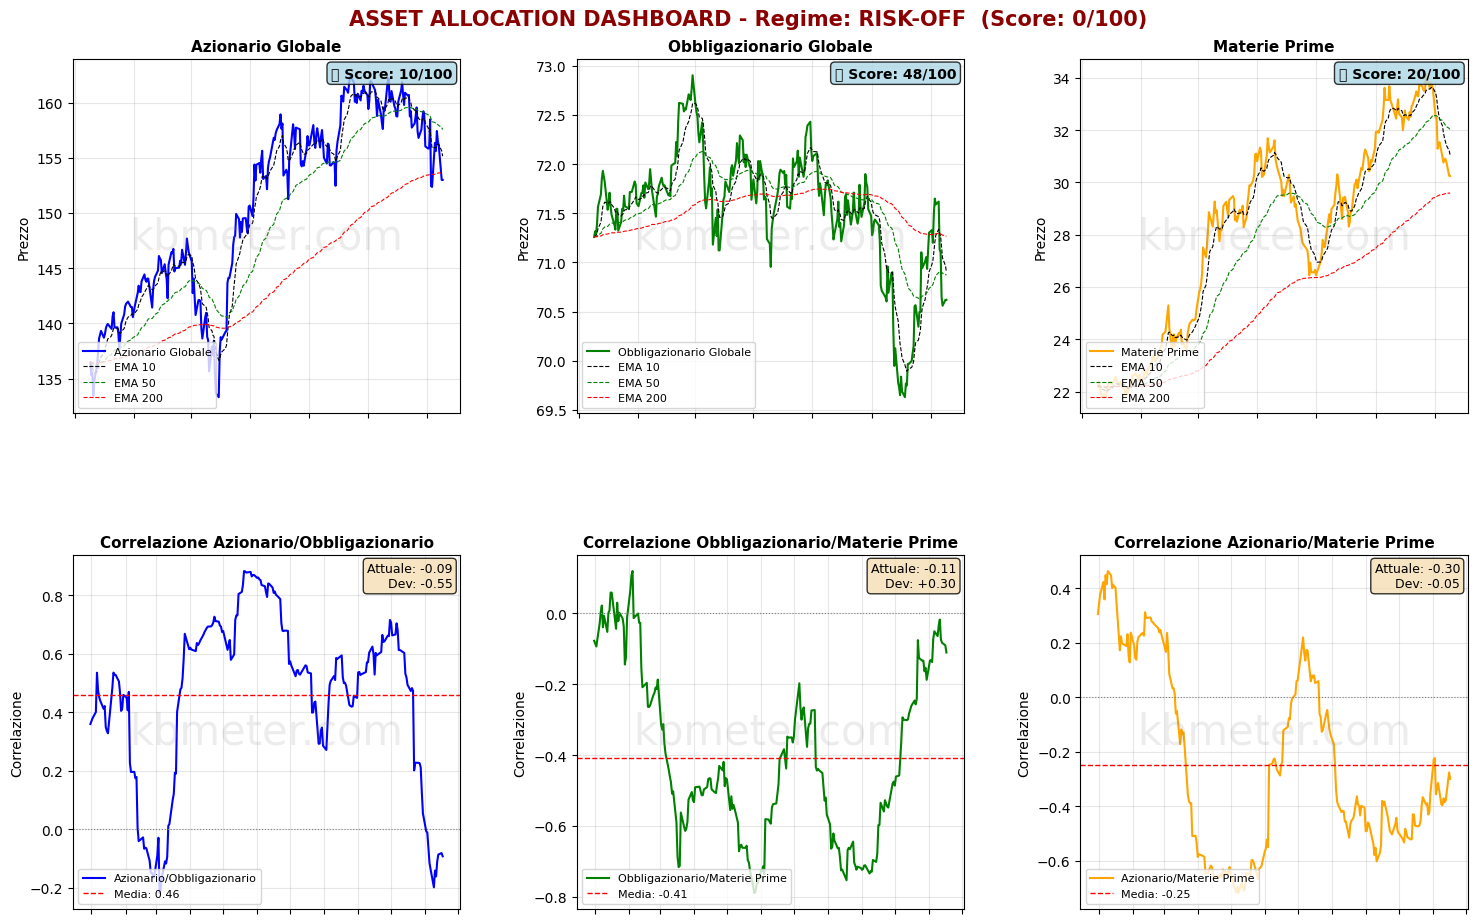
The current situation across asset classes remains noteworthy. Global equities continue to show weakness, trading below their medium-term moving average and around their long-term moving average, within a particularly important support area. Global bonds have seen their recovery come to an abrupt halt and remain below both longer-term moving averages. Commodities, meanwhile, are confirming their short-term bearish trend, with the long-term moving average approaching and set to provide an important test in assessing how the situation may evolve over the coming months.
Our market weather map confirms a challenging environment for both gold and the technology sector, with both currently in the weakness zone. Oil and cryptocurrencies are in a borderline situation, with scores just above 40. Signals remain positive for the US dollar and European equities.
Global Futures – Pre-Market Sentiment
Pre-Market Futures: Global futures point to a moderately risk-off sentiment (-0.46% on average), with US futures slightly lower (-0.07%), European futures down (-0.59%) and Asian futures also slightly negative (-0.48%).
📊 Global Futures – Pre-Market Sentiment
- Nifty 50: +0.67%
- US Tech 100: +0.15%
- USA 500: -0.06%
- Taiwan: -2.14%
- FTSE MIB: -1.05%
- CSI 300: -0.92%
Macroeconomic calendar
On the macroeconomic front, today’s agenda includes UK employment data for the quarter ended in September, an update on Germany’s ZEW Economic Sentiment Index, and US retail sales and industrial production figures for October. The European Commission’s Autumn Economic Forecasts will also be worth monitoring.
As for corporate earnings, the key event of the day will be Nvidia’s results.
Assets to watch
Data as of Nov 16, 2026We have split the KBMeter scores into three bands, depending on their value: Weak, Intermediate or Strong. Here you can see which bands are most at risk of changing over the next 5 days and which ones hold.
The number on the right is the share of similar past cases in which the band had changed after 5 days. The higher it is, the more likely it is to change. The arrow in the current band appears when the asset is close to the border with the neighbouring band.
CONTINUE READING. ACTIVATE YOUR 14-DAY FREE TRIAL NOW. CLICK HERE
Already a subscriber? Login here
It does not say whether the price will rise or fall and it is not investment advice.
Already a subscriber? Login here
NOTES AND WARNINGS
Data compiled by kbmeter.com. Analysis date: 17 November 2026 - 8:40 AM GMT+1
This content is provided for informational purposes only and should not be considered financial advice. All scores and assessments are based on the previous trading day’s closing prices. Futures indications refer to the date and time of the analysis.