Tariffs are back in the spotlight at the start of the week, with Wall Street closed
Against a broader backdrop characterized by a neutral but improving sentiment, the tariff issue comes back into focus. The week opens with a kind of cold shower for financial markets, fueling renewed uncertainty and volatility. With U.S. equity markets closed for Martin Luther King Jr. Day, the burden of the “Greenland issue” weighs mainly on Asian and European markets.
Market Weather Map
January 19, 2026
US Equities
Eu Equities
Asia Equities
Commodities
Bonds
Dollar Index
Technology
Gold
Oil
Crypto
Market Summary
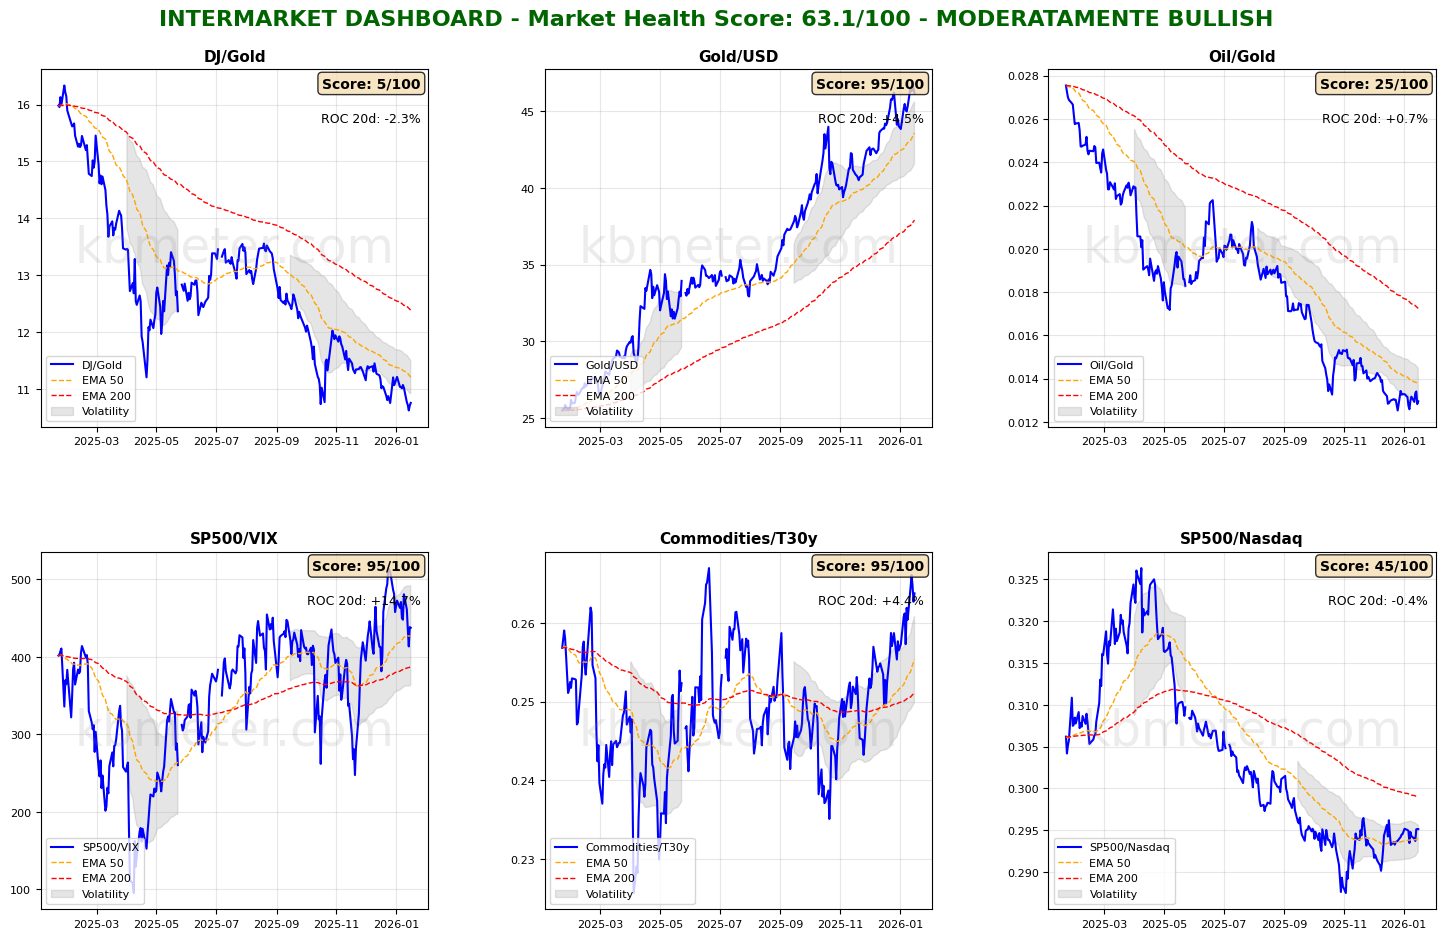
Financial markets today show a neutral sentiment. Intermarket analysis points to a Market Health Score of 63/100 (moderately positive), with risk indicators remaining weak and gold continuing to play a leading role. The three main asset classes continue to fluctuate around the fast moving average and maintain a positive correlation. From a thematic perspective, major asset classes display valuations within a neutral range.
📄 Detailed Intermarket Analysis
INTERMARKET ANALYSIS - 2026-01-19
============================================================

MARKET HEALTH SCORE: 63.1/100
SENTIMENT: MODERATELY BULLISH

============================================================
SUMMARY OF KEY RATIOS
============================================================


DJ/Gold:
  - Component score: 5.0/100
  - Current value: 10.7574
  - Position vs EMA50: BELOW
  - 20-day ROC: -2.33%
  - 50-day ROC: -9.81%
  → Flight to safe havens

Gold/USD:
  - Component score: 95.0/100
  - Current value: 46.1656
  - Position vs EMA50: ABOVE
  - 20-day ROC: +4.46%
  - 50-day ROC: +17.20%

Oil/Gold:
  - Component score: 25.0/100
  - Current value: 0.0130
  - Position vs EMA50: BELOW
  - 20-day ROC: +0.68%
  - 50-day ROC: -15.55%
  → Energy demand improving

SP500/VIX:
  - Component score: 95.0/100
  - Current value: 437.5794
  - Position vs EMA50: ABOVE
  - 20-day ROC: +14.71%
  - 50-day ROC: +22.78%
  → Expanding risk appetite

Commodities/T30y:
  - Component score: 95.0/100
  - Current value: 0.2638
  - Position vs EMA50: ABOVE
  - 20-day ROC: +4.36%
  - 50-day ROC: +6.34%
  → Economic growth expectations

SP500/Nasdaq:
  - Component score: 45.0/100
  - Current value: 0.2951
  - Position vs EMA50: ABOVE
  - 20-day ROC: -0.36%
  - 50-day ROC: +1.76%

============================================================
CONCLUSIONS AND RECOMMENDATIONS
============================================================

The market remains moderately constructive. Some ratios show positive signals,
but elements of caution persist. Monitor developments closely.
Positioning: SELECTIVE, favor quality.


STRONGEST RATIOS:
  • Gold/USD: 95.0/100
  • SP500/VIX: 95.0/100
  • Commodities/T30y: 95.0/100

WEAKEST RATIOS:
  • SP500/Nasdaq: 45.0/100
  • Oil/Gold: 25.0/100
  • DJ/Gold: 5.0/100

============================================================
Analysis automatically generated by kbmeter.com
Date: 2026-01-19
📄 Detailed Asset Allocation Analysis
ASSET ALLOCATION & REGIME ANALYSIS - 2026-01-19
======================================================================
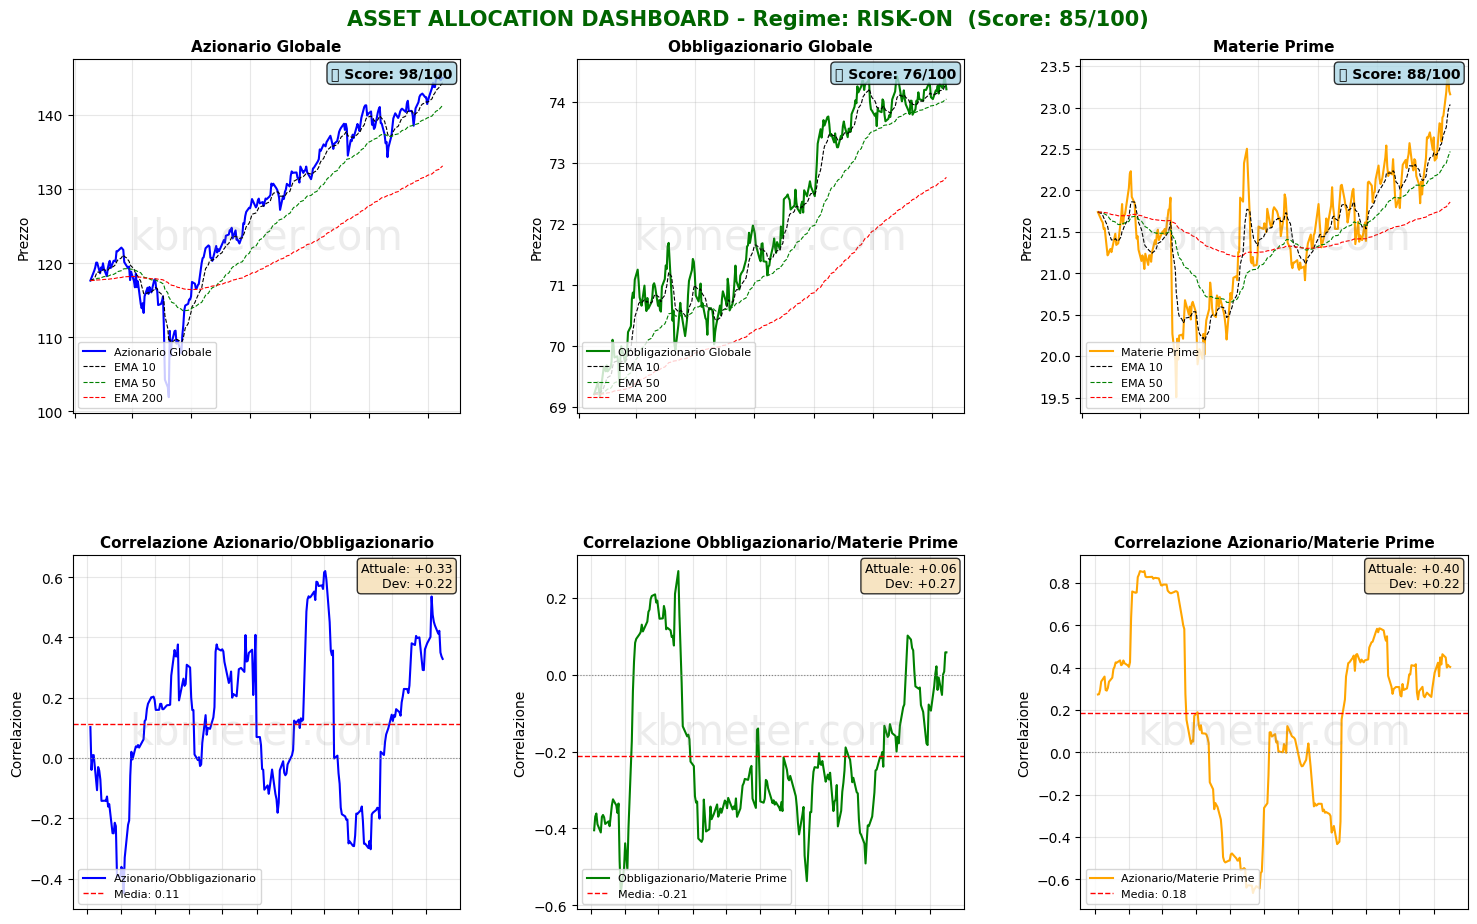
MARKET REGIME: RISK-ON
REGIME SCORE: 85.0/100
======================================================================
TREND AND VOLATILITY ANALYSIS
======================================================================
GLOBAL EQUITIES (ACWI):
Short-Term Trend (5d): -0.26% | ABOVE EMA 10
Medium-Term Trend (20d): +3.79% | ABOVE EMA 50
Long-Term Trend (60d): +5.19% | ABOVE EMA 200
Volatility 5d: 4.7%
Volatility 20d: 7.2%
Volatility 60d: 10.7%
COMMODITIES (DBC):
Medium-Term Trend (20d): +5.51% | ABOVE EMA 50
Volatility 20d: 13.9%
ACWI/BND Correlation (30d): 0.329
REGIME INTERPRETATION:
The market is in a risk-on regime. Equities show positive trends across multiple
time horizons and volatility remains contained. Investors favor risk assets.
Suggested positioning: OVERWEIGHT equities.
======================================================================
ASSET RANKING – WHICH ASSETS ARE STRONGEST?
======================================================================
🥇 1. Global Equities (ACWI) - SCORE: 98/100
Price: $145.00
Trend: ABOVE EMA10 | ABOVE EMA50 | ABOVE EMA200
Performance: 5d -0.26% | 20d +3.79% | 60d +5.19%
Volatility: 5d 4.7% | 20d 7.2% | 60d 10.7%
Drawdown: -0.26%
→ Asset in STRONG HEALTH: positive trends and controlled volatility
🥈 2. Commodities (DBC) - SCORE: 88/100
Price: $23.16
Trend: ABOVE EMA10 | ABOVE EMA50 | ABOVE EMA200
Performance: 5d -0.13% | 20d +5.51% | 60d +6.59%
Volatility: 5d 12.9% | 20d 13.9% | 60d 12.9%
Drawdown: -0.98%
→ Asset in STRONG HEALTH: positive trends and controlled volatility
🥉 3. Global Bonds (BND) - SCORE: 76/100
Price: $74.20
Trend: BELOW EMA10 | ABOVE EMA50 | ABOVE EMA200
Performance: 5d -0.03% | 20d +0.07% | 60d -0.18%
Volatility: 5d 2.5% | 20d 2.4% | 60d 2.9%
Drawdown: -0.31%
→ Asset in STRONG HEALTH: positive trends and controlled volatility
======================================================================
CORRELATION ANALYSIS – CURRENT vs HISTORICAL
======================================================================
ACWI/BND:
Current correlation (30d): +0.329
Historical average (1 year): +0.113
Deviation: +0.216
→ Positive correlation: diversification IMPAIRED
BND/DBC:
Current correlation (30d): +0.059
Historical average (1 year): -0.212
Deviation: +0.271
ACWI/DBC:
Current correlation (30d): +0.403
Historical average (1 year): +0.185
Deviation: +0.218
======================================================================
OPERATIONAL SUMMARY
======================================================================
STRONGEST ASSET: Global Equities (Score: 98/100)
WEAKEST ASSET: Global Bonds (Score: 76/100)
SUGGESTED ACTION: Favor the strongest asset, maintain risk exposure.
DIVERSIFICATION: EXCELLENT – Asset classes are moving independently.
======================================================================
Analysis automatically generated by kbmeter.com
Date: 2026-01-19
Pre-Market Futures: Global futures signal a risk-off sentiment (average -0.60%), with the U.S. down (-0.89%), Europe lower (-0.59%), and Asia slightly negative (-0.26%).
📊 Global Futures – Pre-Market Sentiment
- IBEX 35 derived: +0.52%
- Mini MDAX derived: +0.00%
- FTSE MIB derived: -0.12%
- CAC 40 derived: -1.38%
- Euro Stoxx 50 derived: -1.28%
- US Tech 100 derived: -1.09%
On the macro front, today’s agenda includes data on China’s economic performance in December, the final reading of Euro Area inflation for December, and Canadian inflation figures, also for December.
Already a subscriber? Login here
NOTES AND WARNINGS
Data compiled by kbmeter.com. Analysis date: 19 January 2026 - 7:56 AM GMT+1
This content is provided for informational purposes only and should not be considered financial advice. All scores and assessments are based on the previous trading day’s closing prices. Futures indications refer to the date and time of the analysis.