Risk-On Sentiment Strengthens as Markets Await Fed Decision, Dot Plot
Risk-on sentiment is strengthening across financial markets on this mid-June Wednesday, made especially eventful by anticipation surrounding the Federal Reserve’s decision—the first under the leadership of Warsh. Investors are expecting no change in policy, but attention will focus on the new Chair’s remarks and the updated dot plot, which could provide valuable clues regarding the Fed’s future policy path. These signals will likely play a key role in determining the short-term outlook for both the U.S. dollar and gold, with the dollar’s ongoing strength still preventing a meaningful recovery in the precious metal.
Meanwhile, U.S. equities have reached, according to our Health Scores, valuation levels comparable to those of the technology sector—a signal that, combined with the rebound in cryptocurrencies, points to a further increase in investors’ risk appetite. Futures indicate a positive opening for U.S. markets and a slightly positive start for European equities.
Market Weather Map
June 17, 2026
US Equities
Eu Equities
Asia Equities
Commodities
Bonds
Dollar Index
Technology
Gold
Oil
Crypto
Market Summary
Do you want to see the score details for all assets monitored by KBMeter?
Try free for 14 days →Financial markets sentiment
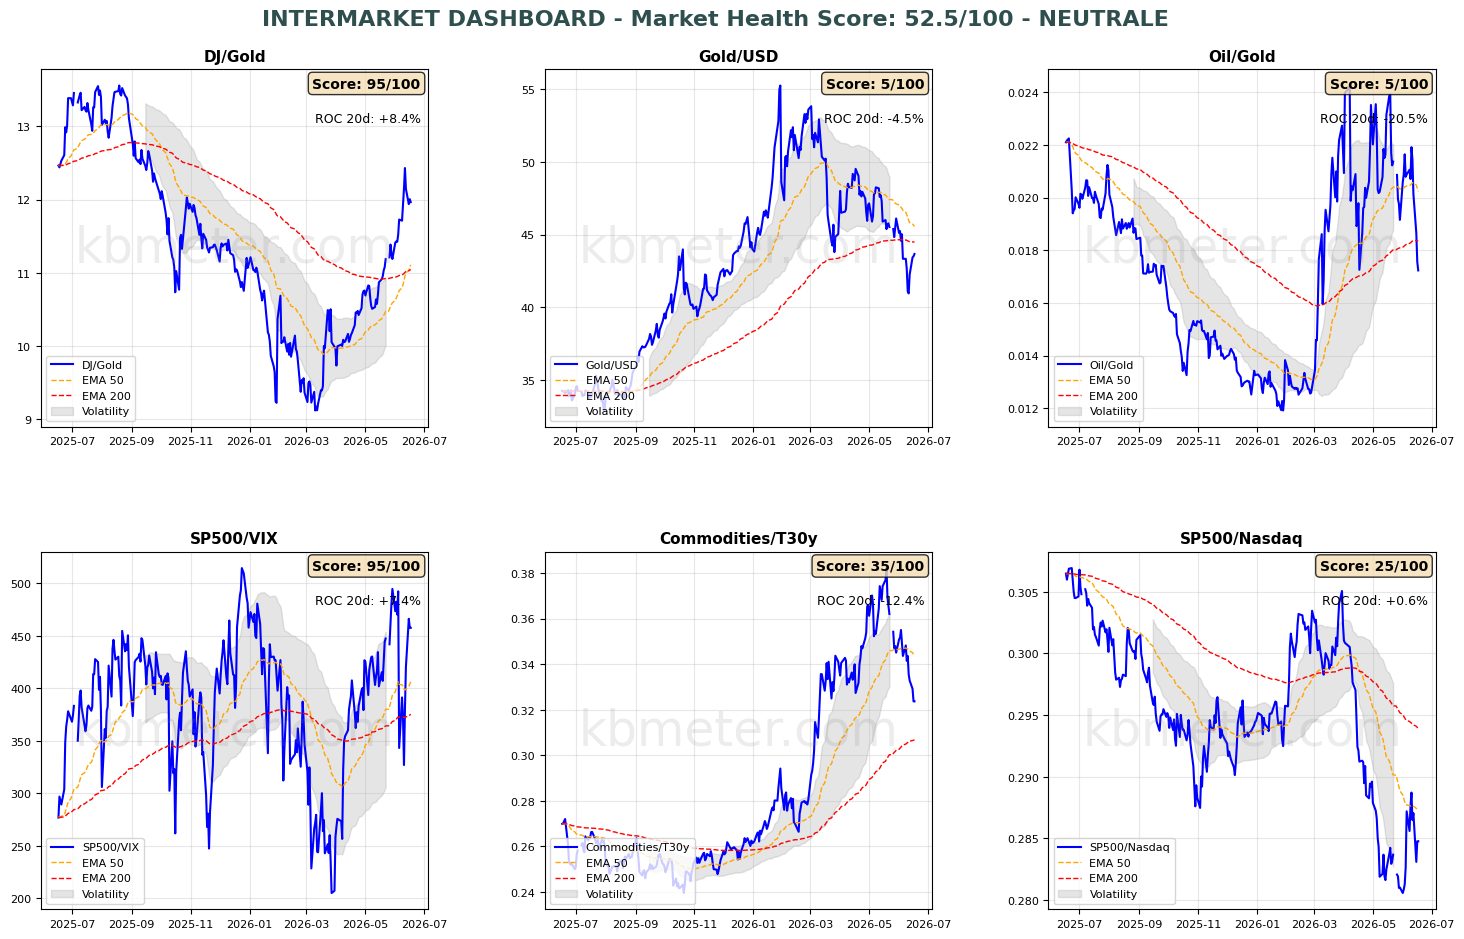
Financial markets are displaying a moderately positive sentiment today. Intermarket analysis shows a Market Health Score of 52/100 (neutral). Our intermarket dashboards continue to signal strengthening risk-on conditions, with risk-appetite ratios returning to levels last seen in early May.
Oil prices continue to weaken, and the oil-to-gold ratio has fallen below its long-term moving average, a clearly bearish signal. Inflation expectations are also being recalibrated: the commodities-to-bonds ratio has returned to early-March levels and is testing a key support area. A break below this level could lead the ratio toward its long-term moving average.
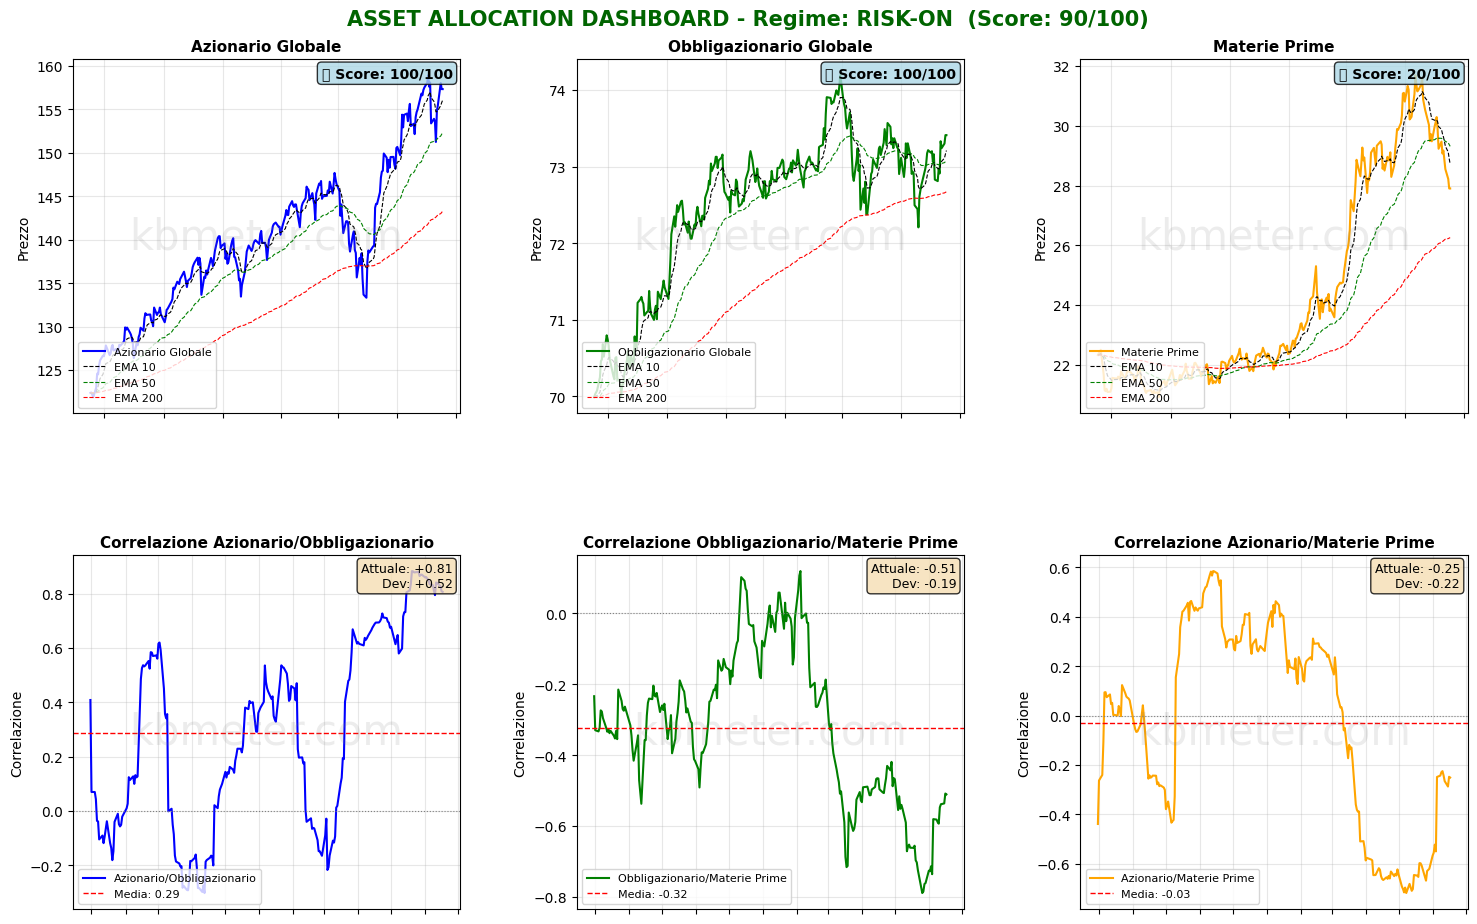
The scenario described above is reflected in the performance of the major asset classes: global equities and bonds continue to recover and are moving further away from their medium-term moving averages, while commodities remain under pressure and are approaching a key static support zone. The correlation between equities and bonds remains strongly positive.
Our Health Scores show U.S. equities reaching levels comparable to those of the technology sector—a development not seen for several weeks—within an overall moderately positive equity environment. Bonds continue to recover, while cryptocurrencies have also strengthened significantly, gaining more than four points in a single session, another indication of increasing risk-on sentiment. Crypto assets have now moved back above the 40-point threshold.
The U.S. dollar remains relatively strong, continuing to limit gold’s recovery. In this respect, the Health Scores somewhat temper the signal emerging from the intermarket ratio analysis.
Global Futures – Pre-Market Sentiment
Pre-Market Futures. Global futures point to a moderate risk-on sentiment (average +0.20%), with U.S. futures slightly positive (+0.32%), European futures marginally higher (+0.08%), and Asian futures also positive (+0.37%).
📊 Global Futures – Pre-Market Sentiment
- Nikkei 225 derived: +1.40%
- FTSE MIB derived: +1.17%
- IBEX 35 derived: +0.74%
- TecDAX derived: -0.80%
- Hang Seng derived: -0.54%
- Mini DAX: -0.41%
Intermarket details
Macroeconomic calendar
The key event of the day is the Federal Reserve’s policy decision at the conclusion of the first meeting chaired by Kevin Warsh. Markets expect no policy change, but there is considerable interest in the new Chair’s comments and the updated dot plot projections. Other noteworthy releases include Japan’s May 2026 export data, the United Kingdom’s May 2026 inflation figures, and U.S. May 2026 retail sales data.
Already a subscriber? Login here
NOTES AND WARNINGS
Data compiled by kbmeter.com. Analysis date: 17 June 2026 - 7:50 AM GMT+1
This content is provided for informational purposes only and should not be considered financial advice. All scores and assessments are based on the previous trading day’s closing prices. Futures indications refer to the date and time of the analysis.