Risk-off mood lingers as Trump looms and Japan’s debt worries resurface
Risk-off wave has now completed its global sweep, reaching U.S. equity markets as well, while bond markets are also under pressure amid renewed concerns over the sustainability of Japan’s public debt. Futures point to another uncertain start to today’s session, with hopes that talks in Davos may help pave the way for a swift resolution of the U.S.–EU dispute. Financial markets remain in a moderately risk-off mode.
Market Weather Map
January 21, 2026
US Equities
Eu Equities
Asia Equities
Commodities
Bonds
Dollar Index
Technology
Gold
Oil
Crypto
Market Summary
📊 Global Futures – Pre-Market Sentiment
- Nikkei 225 derived: +1.13%
- Hang Seng derived: +0.57%
- Russell 2000: +0.50%
- IBEX 35 derived: -1.75%
- TecDAX derived: -1.53%
- FTSE MIB derived: -1.07%
Pre-Market Futures: Global futures point to a moderate risk-off sentiment (average -0.09%), with U.S. markets slightly positive (+0.35%), Europe slightly negative (-0.44%), and Asia slightly positive (+0.40%).
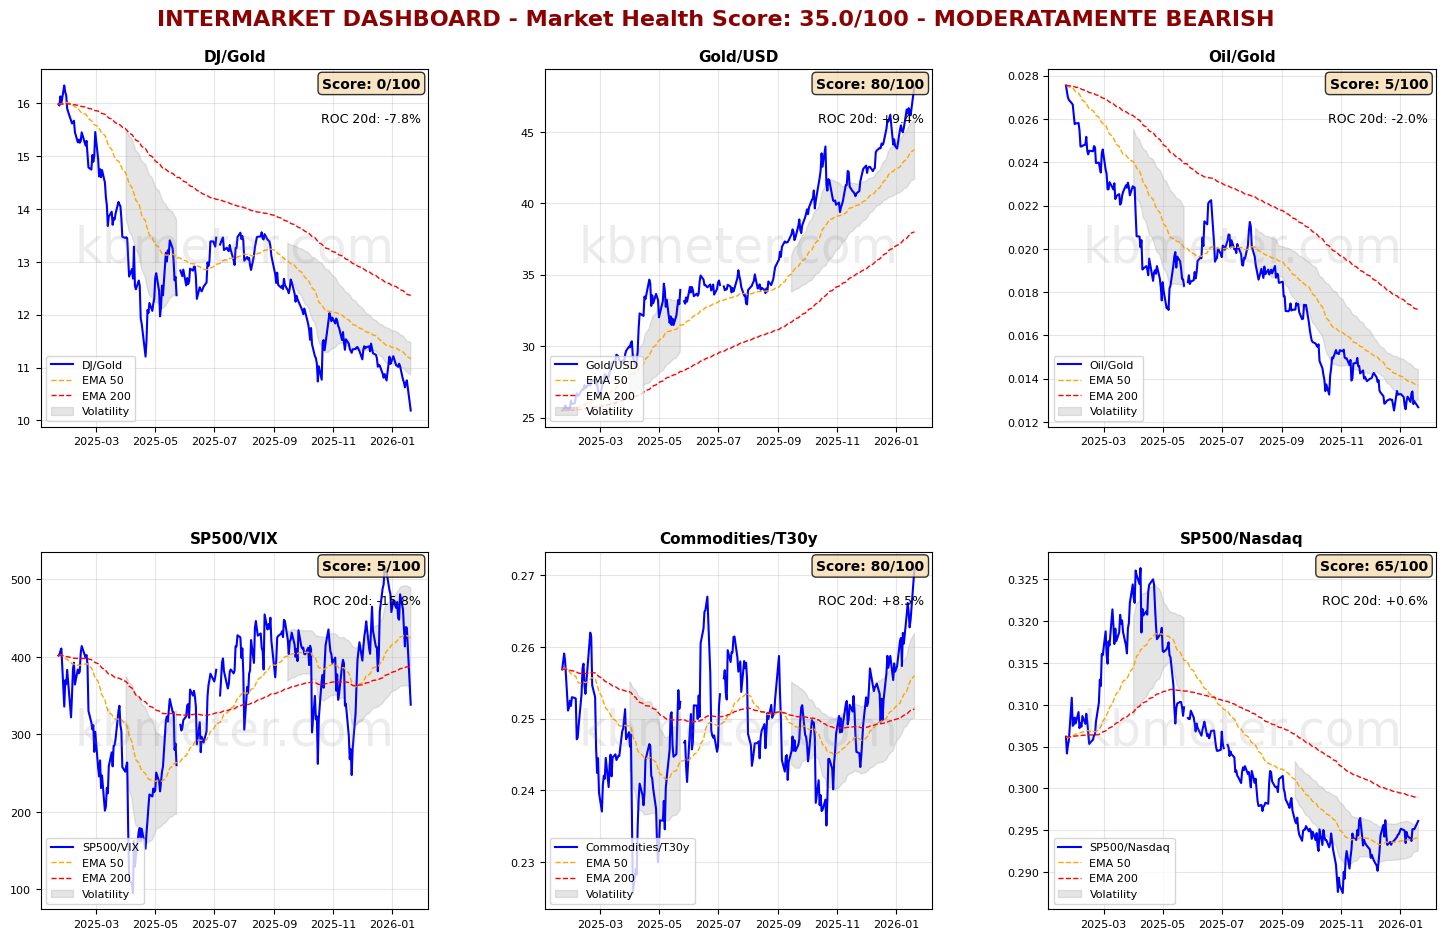
Financial markets today are showing a sentiment ranging from neutral to mildly negative. Intermarket analysis highlights a Market Health Score of 35/100, indicating a moderately negative backdrop. Intermarket dashboards capture a sharp slowdown in risk indicators, with the S&P 500/VIX ratio slipping back below its medium-term moving average and returning to levels last seen in November. Gold continues to strengthen against both the U.S. dollar and the Dow.
Global equities remain above the 50-day moving average, while bonds—also pressured by heavy selling in Japanese government debt—have moved slightly below their medium-term moving average, heading toward late-2025 support levels. For now, medium-term trends remain intact.
📄 Detailed Intermarket Analysis
INTERMARKET ANALYSIS - 2026-01-21
============================================================

MARKET HEALTH SCORE: 35.0/100
SENTIMENT: MODERATELY BEARISH

============================================================
SUMMARY OF KEY RATIOS
============================================================


DJ/Gold:
  - Component score: 0.0/100
  - Current value: 10.1875
  - Position vs EMA50: BELOW
  - 20-day ROC: -7.81%
  - 50-day ROC: -14.29%
  - ⚠️ ANOMALY DETECTED – Significant deviation from the mean
  → Flight to safe havens

Gold/USD:
  - Component score: 80.0/100
  - Current value: 48.2522
  - Position vs EMA50: ABOVE
  - 20-day ROC: +9.45%
  - 50-day ROC: +21.47%
  - ⚠️ ANOMALY DETECTED – Significant deviation from the mean

Oil/Gold:
  - Component score: 5.0/100
  - Current value: 0.0127
  - Position vs EMA50: BELOW
  - 20-day ROC: -2.02%
  - 50-day ROC: -15.33%
  → Weakening energy demand

SP500/VIX:
  - Component score: 5.0/100
  - Current value: 338.3205
  - Position vs EMA50: BELOW
  - 20-day ROC: -15.75%
  - 50-day ROC: -10.35%
  → Contracting risk appetite

Commodities/T30y:
  - Component score: 80.0/100
  - Current value: 0.2710
  - Position vs EMA50: ABOVE
  - 20-day ROC: +8.48%
  - 50-day ROC: +8.38%
  - ⚠️ ANOMALY DETECTED – Significant deviation from the mean
  → Economic growth expectations

SP500/Nasdaq:
  - Component score: 65.0/100
  - Current value: 0.2961
  - Position vs EMA50: ABOVE
  - 20-day ROC: +0.55%
  - 50-day ROC: +2.38%

============================================================
CONCLUSIONS AND RECOMMENDATIONS
============================================================

The market is showing signs of weakness. Several ratios are in negative territory.
Risk appetite is declining. Increased caution is warranted.
Positioning: DEFENSIVE, favor safe-haven assets.


STRONGEST RATIOS:
  • Gold/USD: 80.0/100
  • Commodities/T30y: 80.0/100
  • SP500/Nasdaq: 65.0/100

WEAKEST RATIOS:
  • Oil/Gold: 5.0/100
  • SP500/VIX: 5.0/100
  • DJ/Gold: 0.0/100

============================================================
Analysis automatically generated by kbmeter.com
Date: 2026-01-21
📄 Detailed Asset Allocation Analysis
ASSET ALLOCATION & REGIME ANALYSIS - 2026-01-21
======================================================================
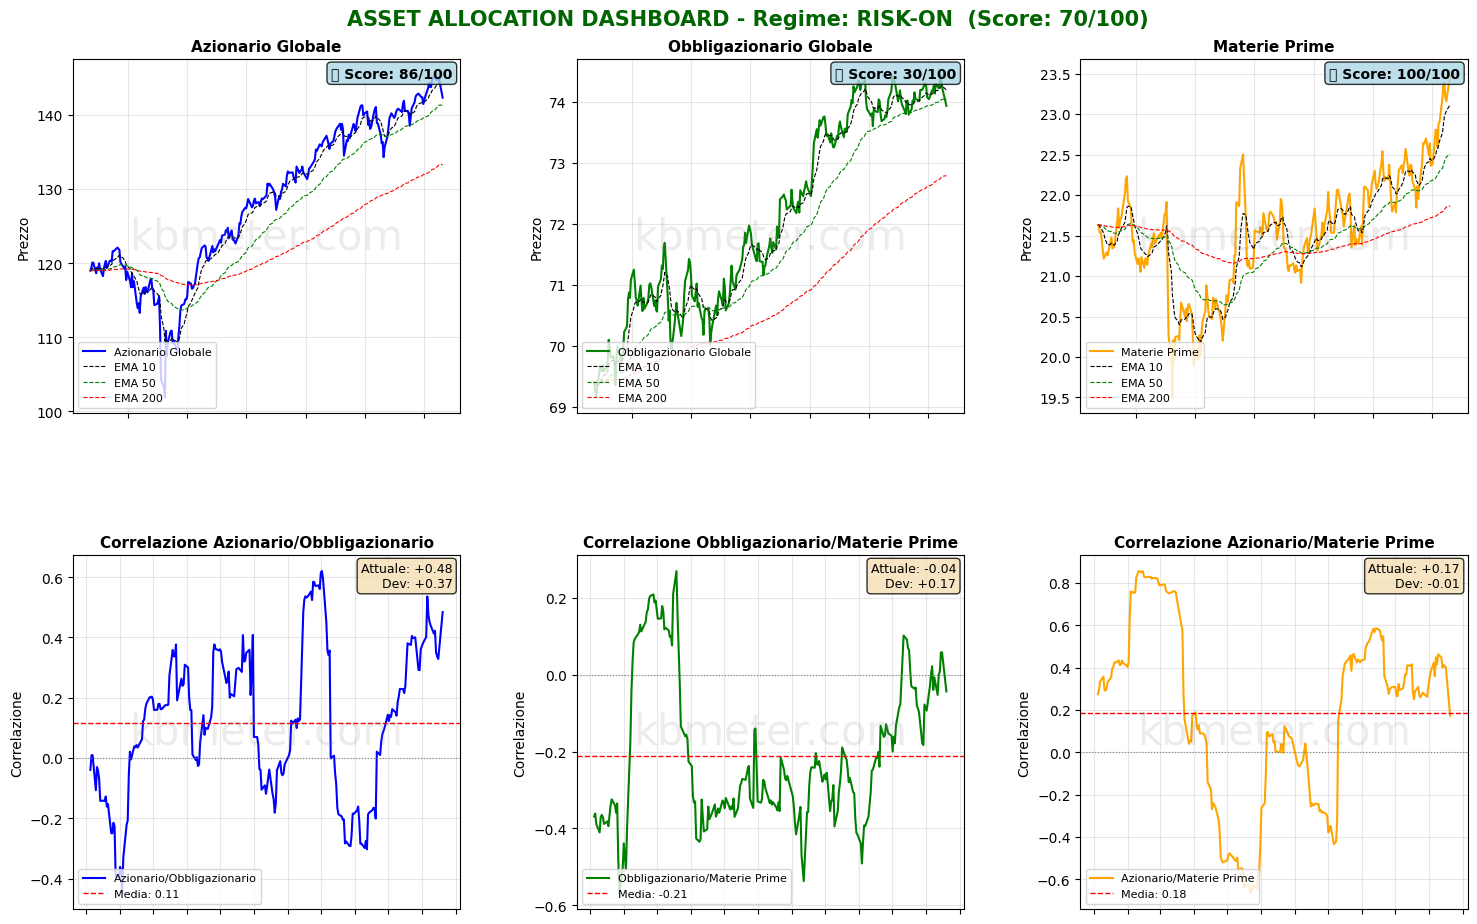
MARKET REGIME: RISK-ON
REGIME SCORE: 70.0/100
======================================================================
TREND AND VOLATILITY ANALYSIS
======================================================================
GLOBAL EQUITIES (ACWI):
Short-Term Trend (5d): -1.75% | BELOW EMA 10
Medium-Term Trend (20d): +1.03% | ABOVE EMA 50
Long-Term Trend (60d): +2.62% | ABOVE EMA 200
Volatility 5d: 12.8%
Volatility 20d: 9.9%
Volatility 60d: 11.3%
COMMODITIES (DBC):
Medium-Term Trend (20d): +6.22% | ABOVE EMA 50
Volatility 20d: 14.0%
ACWI/BND Correlation (30d): 0.484
REGIME INTERPRETATION:
The market remains in a risk-on regime. Equities show positive trends across
multiple time horizons and volatility remains contained. Investors continue
to favor risk assets.
Suggested positioning: OVERWEIGHT equities.
======================================================================
ASSET RANKING – WHICH IS PERFORMING BEST?
======================================================================
🥇 1. Commodities (DBC) - SCORE: 100/100
Price: $23.48
Trend: ABOVE EMA10 | ABOVE EMA50 | ABOVE EMA200
Performance: 5d +0.47% | 20d +6.22% | 60d +6.26%
Volatility: 5d 13.5% | 20d 14.0% | 60d 12.8%
Drawdown: 0.00%
→ Asset in STRONG HEALTH: positive trends and controlled volatility
🥈 2. Global Equities (ACWI) - SCORE: 86/100
Price: $142.36
Trend: BELOW EMA10 | ABOVE EMA50 | ABOVE EMA200
Performance: 5d -1.75% | 20d +1.03% | 60d +2.62%
Volatility: 5d 12.8% | 20d 9.9% | 60d 11.3%
Drawdown: -2.08%
→ Asset in STRONG HEALTH: positive trends and controlled volatility
🥉 3. Global Bonds (BND) - SCORE: 30/100
Price: $73.93
Trend: BELOW EMA10 | BELOW EMA50 | ABOVE EMA200
Performance: 5d -0.47% | 20d -0.15% | 60d -0.35%
Volatility: 5d 3.5% | 20d 2.7% | 60d 3.0%
Drawdown: -0.67%
→ Asset in WEAK CONDITIONS: negative trends or elevated volatility
======================================================================
CORRELATION ANALYSIS – CURRENT vs HISTORICAL
======================================================================
ACWI/BND:
Current correlation (30d): +0.484
Historical average (1 year): +0.115
Deviation: +0.369
⚠️ SIGNIFICANT DEVIATION from historical average
→ Positive correlation: diversification COMPROMISED
BND/DBC:
Current correlation (30d): -0.043
Historical average (1 year): -0.211
Deviation: +0.167
ACWI/DBC:
Current correlation (30d): +0.173
Historical average (1 year): +0.184
Deviation: -0.012
======================================================================
OPERATIONAL SUMMARY
======================================================================
STRONGEST ASSET: Commodities (Score: 100/100)
WEAKEST ASSET: Global Bonds (Score: 30/100)
SUGGESTED ACTION: Favor the strongest asset, maintain exposure to risk.
DIVERSIFICATION: EXCELLENT – asset classes are moving independently.
======================================================================
Analysis automatically generated by kbmeter.com
Date: 2026-01-21
On the macro front, the focus is on UK inflation data for December 2025, while markets are also awaiting comments from ECB President Christine Lagarde on the current geopolitical environment and its potential implications for euro area monetary policy.
Already a subscriber? Login here
NOTES AND WARNINGS
Data compiled by kbmeter.com. Analysis date: 21 January 2026 - 7:42 AM GMT+1
This content is provided for informational purposes only and should not be considered financial advice. All scores and assessments are based on the previous trading day’s closing prices. Futures indications refer to the date and time of the analysis.