
Middle East Optimism Drives Markets at Start of Week; Focus Turns to European Stocks With Wall Street Closed
Perhaps we’re finally there. Those few words could sum up the sentiment with which financial markets are preparing to start the week. Positive news coming from the Middle East, albeit accompanied by necessary caution, will be the main catalyst at the beginning of the week. The main protagonists: equities, bonds, the dollar, and oil — with the first two expected to rise and oil declining. The outlook for the dollar remains more uncertain, as much will depend on how expectations around inflation and interest rates evolve. In this regard, the April PCE inflation data will be particularly important. Futures point to a positive opening for Europe, while Wall Street will remain closed for Memorial Day.
KEY SIGNALS TODAY
① Europe accelerates and overtakes the US — EU equities reach a score of 59.35 (+6.14 over 7 days), surpassing US equities (58.40) for the first time in weeks. The DAX (+16.47) and CAC40 (+15.61) were last week’s strongest movers overall.
② Oil under structural pressure — Oil falls to a score of 45.40 with a 7-day delta of −14.38 points: the sharpest decline among all monitored asset classes. The Oil/Gold ratio is currently at the 10th historical percentile. The move is not yet confirmed by visible macro fundamentals, but the speed of the decline signals a repositioning of market expectations.
Market Weather Map
May 25, 2026
US Equities
Eu Equities
Asia Equities
Commodities
Bonds
Dollar Index
Technology
Gold
Oil
Crypto
Market Summary
Do you want to see the score details for all assets monitored by KBMeter?
Try free for 14 days →Financial markets sentiment
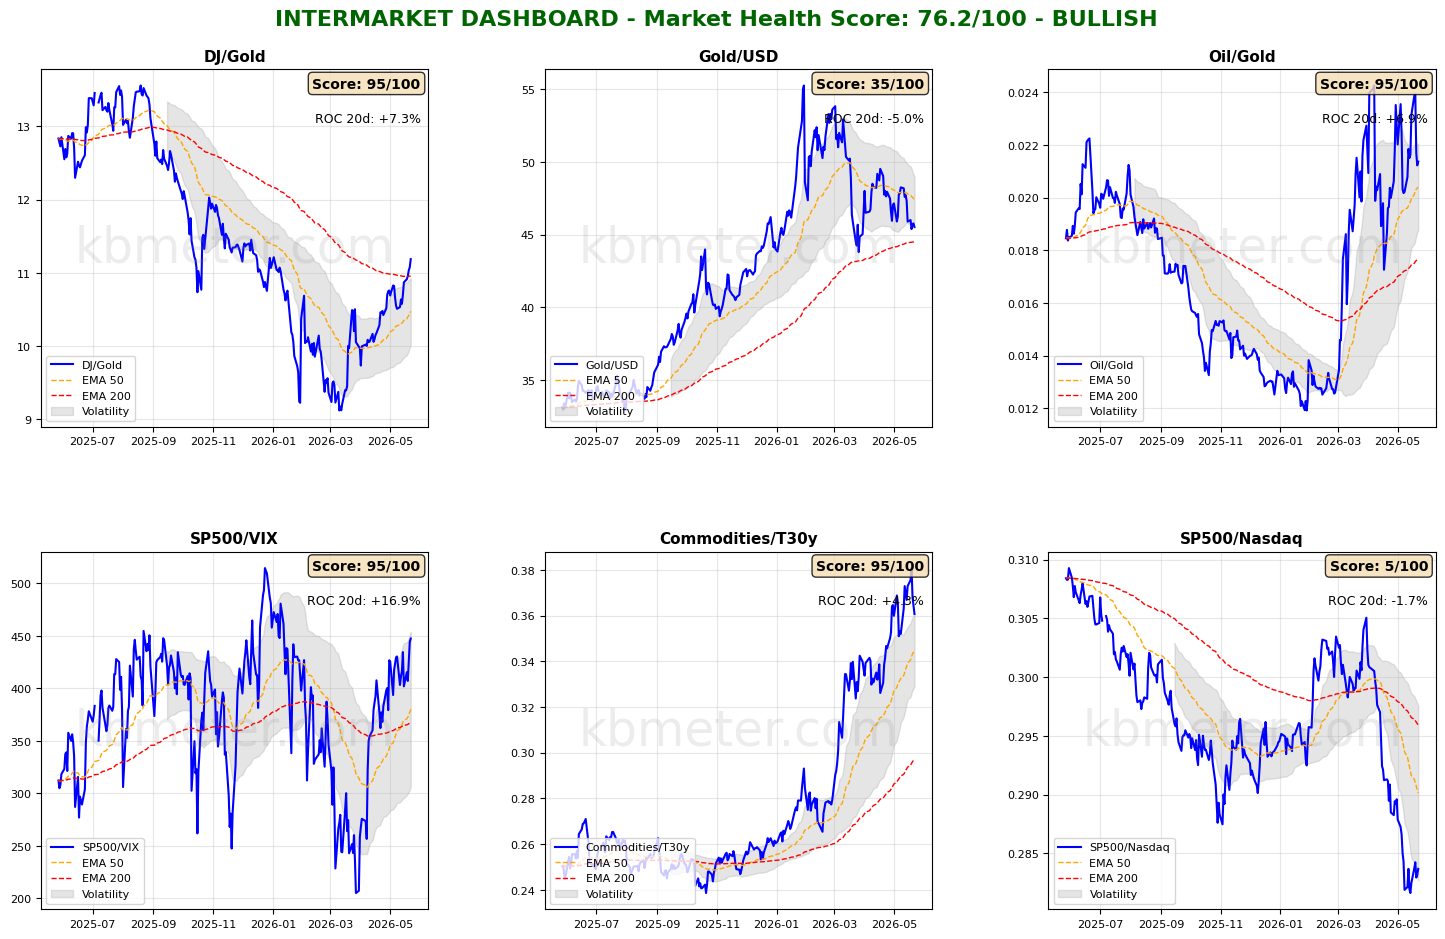
Financial markets are currently showing moderately positive sentiment. Intermarket analysis highlights a Market Health Score of 76/100 (positive). Friday’s session brought few significant changes to our intermarket dashboards. Worth highlighting is the consolidation of the Dow/Gold ratio above its 200-day moving average and the return of the main risk appetite indicator, the S&P500/VIX ratio, to levels seen at the beginning of the year. Another interesting element — to be monitored alongside developments in the Middle East — is the retreat from recent highs in the Commodities/Bonds ratio, a signal that, if confirmed, would point to more temporary and less severe inflation expectations.
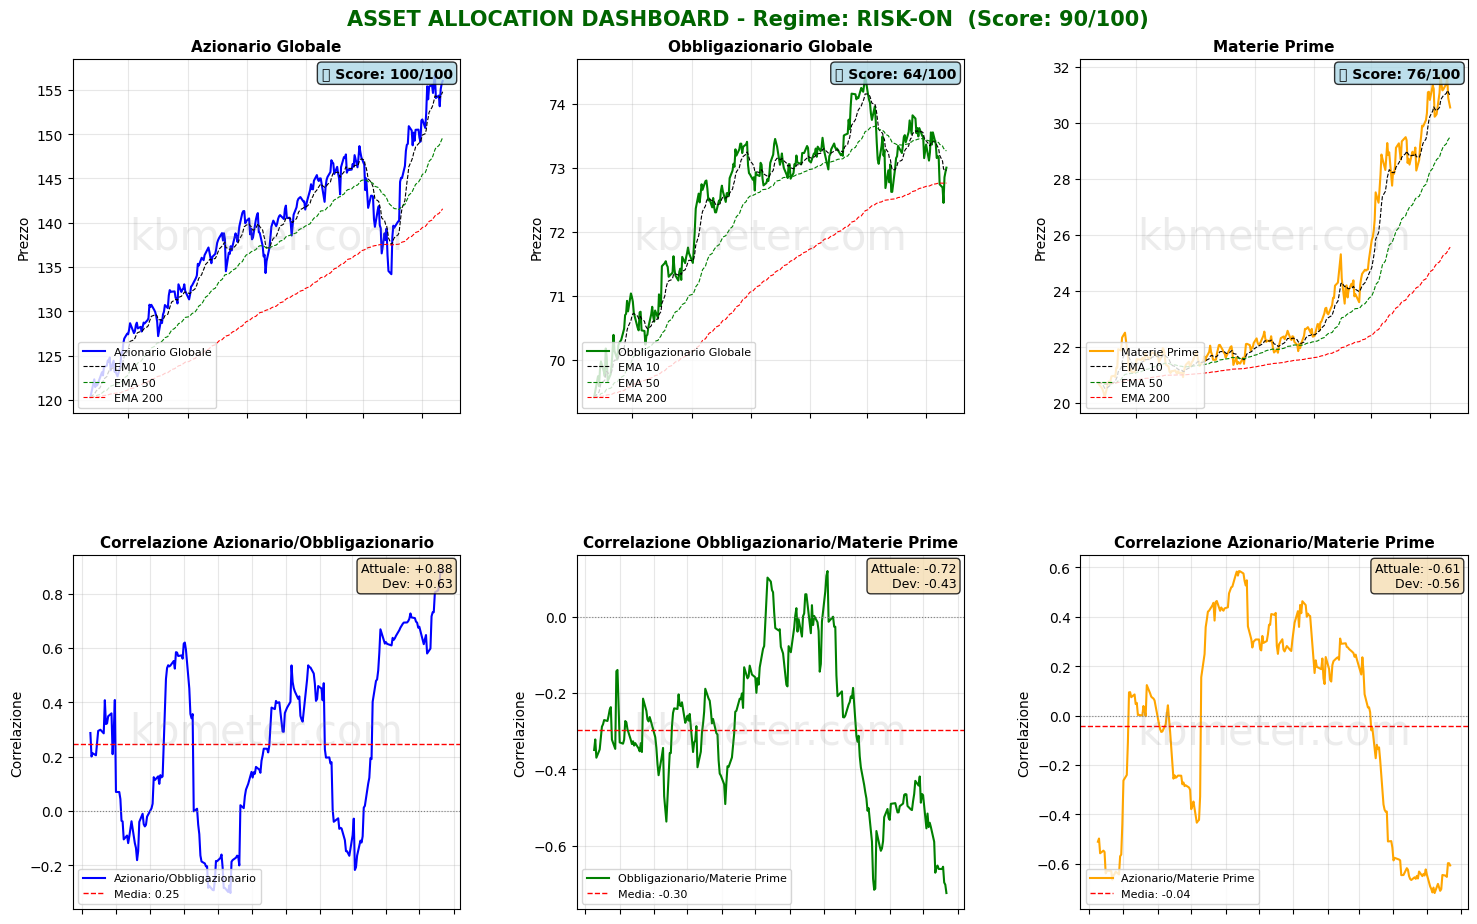
Asset classes are starting the week from different positions. Equities continue to confirm a short-term bullish trend, bonds will attempt to reclaim the 50-day moving average area to validate the rebound, while commodities appear to be stabilizing as the energy sector loses momentum.
Global Futures – Pre-Market Sentiment
Pre-Market Futures: Global futures indicate a risk-on sentiment (+0.70% average), with the US strongly positive (+1.06%), Europe slightly positive (+0.46%), and Asia positive (+0.94%).
📊 Global Futures – Pre-Market Sentiment
- Nikkei 225 derived: +3.26%
- TecDAX derived: +1.80%
- US Tech 100 derived: +1.40%
- IBEX 35 derived: -1.29%
- Hang Seng derived: -0.43%
- FTSE MIB derived: -0.36%
Intermarket details
📄 Detailed Intermarket Analysis
INTERMARKET ANALYSIS - 2026-05-25
============================================================

MARKET HEALTH SCORE: 76.2/100
SENTIMENT: BULLISH

============================================================
SUMMARY OF MAIN RATIOS
============================================================


DJ/Gold:
  - Component score: 95.0/100
  - Current value: 11.1877
  - Position vs EMA50: ABOVE
  - 20-day ROC: +7.31%
  - 50-day ROC: +22.62%
  → Preference for risk assets vs safe havens

Gold/USD:
  - Component score: 35.0/100
  - Current value: 45.5195
  - Position vs EMA50: BELOW
  - 20-day ROC: -5.04%
  - 50-day ROC: -11.25%

Oil/Gold:
  - Component score: 95.0/100
  - Current value: 0.0214
  - Position vs EMA50: ABOVE
  - 20-day ROC: +6.89%
  - 50-day ROC: +14.18%
  → Rising energy demand

SP500/VIX:
  - Component score: 95.0/100
  - Current value: 447.5132
  - Position vs EMA50: ABOVE
  - 20-day ROC: +16.86%
  - 50-day ROC: +83.03%
  → Expanding risk appetite

Commodities/T30y:
  - Component score: 95.0/100
  - Current value: 0.3607
  - Position vs EMA50: ABOVE
  - 20-day ROC: +4.34%
  - 50-day ROC: +7.85%
  → Economic growth expectations

SP500/Nasdaq:
  - Component score: 5.0/100
  - Current value: 0.2837
  - Position vs EMA50: BELOW
  - 20-day ROC: -1.66%
  - 50-day ROC: -5.14%

============================================================
CONCLUSIONS AND RECOMMENDATIONS
============================================================

The market is showing broad-based strength signals. Intermarket ratios suggest
a risk-friendly environment. Elevated risk appetite and positive trends.
Positioning: CONSTRUCTIVE on risk assets.


STRONGEST RATIOS:
  • DJ/Gold: 95.0/100
  • Oil/Gold: 95.0/100
  • SP500/VIX: 95.0/100

WEAKEST RATIOS:
  • Commodities/T30y: 95.0/100
  • Gold/USD: 35.0/100
  • SP500/Nasdaq: 5.0/100

============================================================
Analysis automatically generated by kbmeter.com
Date: 2026-05-25
📄 Detailed Asset Allocation Analysis
ASSET ALLOCATION & REGIME ANALYSIS - 2026-05-25
======================================================================

MARKET REGIME: RISK-ON
REGIME SCORE: 90.0/100

======================================================================
TREND AND VOLATILITY ANALYSIS
======================================================================

GLOBAL EQUITIES (ACWI):
  Short-Term Trend (5d): +1.06% | ABOVE EMA 10
  Medium-Term Trend (20d): +3.64% | ABOVE EMA 50
  Long-Term Trend (60d): +5.84% | ABOVE EMA 200

  5d Volatility: 11.6%
  20d Volatility: 14.6%
  60d Volatility: 18.0%

COMMODITIES (DBC):
  Medium-Term Trend (20d): +1.50% | ABOVE EMA 50
  20d Volatility: 23.0%

ACWI/BND Correlation (30d): 0.878

REGIME INTERPRETATION:
The market is in a risk-on regime. Equities are showing positive trends across
multiple time horizons and volatility remains contained. Investors are favoring risk assets.
Suggested positioning: OVERWEIGHT equities.

======================================================================
ASSET RANKING - WHO IS PERFORMING BEST?
======================================================================

🥇 1. Global Equities (ACWI) - SCORE: 100/100
     Price: $155.99
     Trend: ABOVE EMA10 | ABOVE EMA50 | ABOVE EMA200
     Performance: 5d +1.06% | 20d +3.64% | 60d +5.84%
     Volatility: 5d 11.6% | 20d 14.6% | 60d 18.0%
     Drawdown: -0.42%
     → Asset in STRONG HEALTH: positive trends and controlled volatility

🥈 2. Commodities (DBC) - SCORE: 76/100
     Price: $30.54
     Trend: BELOW EMA10 | ABOVE EMA50 | ABOVE EMA200
     Performance: 5d -2.68% | 20d +1.50% | 60d +21.67%
     Volatility: 5d 19.4% | 20d 23.0% | 60d 25.0%
     Drawdown: -3.63%
     → Asset in STRONG HEALTH: positive trends and controlled volatility

🥉 3. Global Bonds (BND) - SCORE: 64/100
     Price: $73.00
     Trend: ABOVE EMA10 | BELOW EMA50 | ABOVE EMA200
     Performance: 5d +0.43% | 20d -0.68% | 60d -1.94%
     Volatility: 5d 5.1% | 20d 4.6% | 60d 4.6%
     Drawdown: -1.94%
     → Asset in FAIR condition: mostly positive signals

======================================================================
CORRELATION ANALYSIS - CURRENT vs HISTORICAL
======================================================================

ACWI/BND:
  Current Correlation (30d): +0.878
  Historical Average (1 year): +0.246
  Deviation: +0.632
  ⚠️ SIGNIFICANT DEVIATION from historical average
  → Positive correlation: diversification COMPROMISED

BND/DBC:
  Current Correlation (30d): -0.724
  Historical Average (1 year): -0.296
  Deviation: -0.428
  ⚠️ SIGNIFICANT DEVIATION from historical average

ACWI/DBC:
  Current Correlation (30d): -0.606
  Historical Average (1 year): -0.044
  Deviation: -0.563
  ⚠️ SIGNIFICANT DEVIATION from historical average
  → Negative correlation: possible supply-driven shift

======================================================================
OPERATIONAL SUMMARY
======================================================================

STRONGEST ASSET: Global Equities (Score: 100/100)
WEAKEST ASSET: Global Bonds (Score: 64/100)

SUGGESTED ACTION: Favor the strongest asset, maintain risk exposure.
DIVERSIFICATION: WEAK - Asset classes tend to move together.

======================================================================
Analysis automatically generated by kbmeter.com
Date: 2026-05-25
Macroeconomic calendar
Today’s macro calendar is light, with no major economic data releases expected.
Already a subscriber? Login here
NOTES AND WARNINGS
Data compiled by kbmeter.com. Analysis date: 25 May 2026 - 7:23 AM GMT+1
This content is provided for informational purposes only and should not be considered financial advice. All scores and assessments are based on the previous trading day’s closing prices. Futures indications refer to the date and time of the analysis.
