
Middle East Escalation Weighs on Market Sentiment; Focus Turns to BoE and ECB as Powell and BoJ Fail to Reassure Investors
Financial markets are once again wavering in response to news of a worsening situation in the Middle East. In this environment, with sentiment oscillating between neutral and moderately negative, investors are looking to central banks, though the likelihood that policymakers will commit to any forward guidance remains very low for now. This is reflected in Powell’s remarks yesterday and could be confirmed by comments from Lagarde and Bailey today. Meanwhile, the Bank of Japan has left rates unchanged.
Volatility remains at very elevated levels, and futures point to a weak opening for the United States and a negative one for Europe.
Market Weather Map
March 19, 2026
US Equities
Eu Equities
Asia Equities
Commodities
Bonds
Dollar Index
Technology
Gold
Oil
Crypto
Market Summary
Financial markets today show a neutral to moderately negative sentiment. Intermarket analysis highlights a Market Health Score of 5/100 (negative). Our intermarket dashboards indicate a frozen sentiment backdrop, with risk appetite indicators stuck at low levels, while macro indicators (Commodities/Treasuries and Oil/Gold) remain near their highs. Equities and bonds continue to test the resistance area seen at the end of 2025, with global equities approaching their long-term moving average, while correlation with bonds rises above the one-year average.
Our “weather map” shows that none of the monitored assets exceed 60 points, and only two are above 55. Notably, the Health Score for gold is declining sharply, weakened by inflation expectations and a strong dollar.
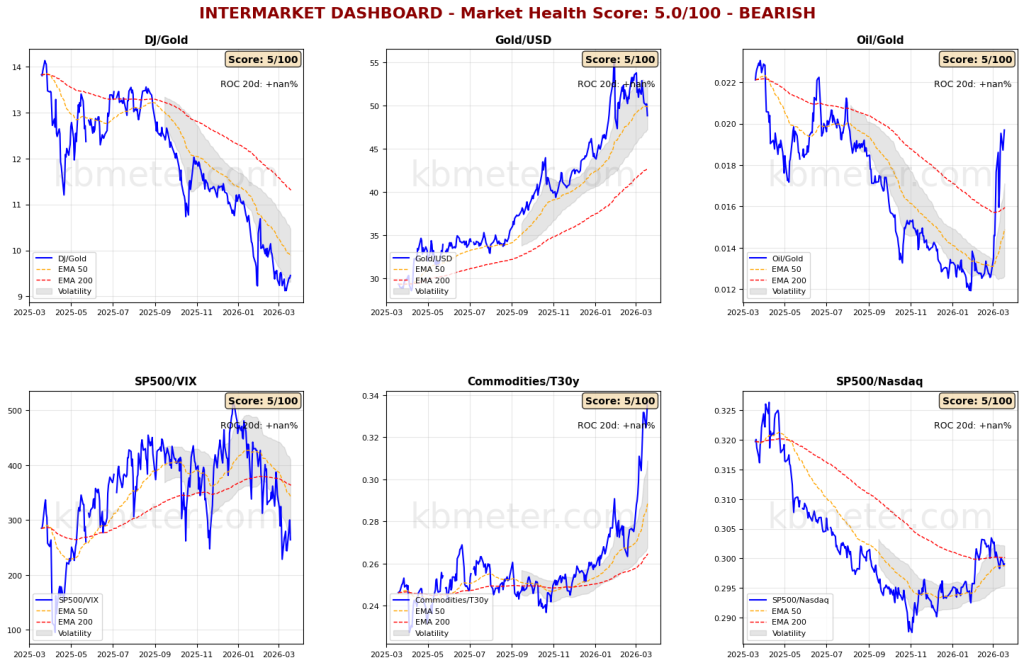
Pre-Market Futures: Global futures signal a moderate risk-off sentiment (average -0.49%), with the U.S. slightly negative (-0.15%), Europe negative (-0.74%), and Asia slightly negative (-0.21%).
📊 Global Futures – Pre-Market Sentiment
- CAC 40 derived: +0.88%
- CSI 300: +0.06%
- Mini MDAX derived: +0.00%
- Euro Stoxx 50 derived: -1.99%
- Mini DAX: -1.98%
- DAX derived: -1.91%
📄 Detailed Intermarket Analysis
INTERMARKET ANALYSIS - 2026-03-19
============================================================

MARKET HEALTH SCORE: 5.0/100
SENTIMENT: BEARISH

============================================================
SUMMARY OF KEY RATIOS
============================================================


DJ/Gold:
  - Component score: 5.0/100
  - Current value: nan
  - Position vs EMA50: BELOW
  - 20-day ROC: +nan%
  - 50-day ROC: +nan%
  → Flight to safe haven

Gold/USD:
  - Component score: 5.0/100
  - Current value: nan
  - Position vs EMA50: BELOW
  - 20-day ROC: +nan%
  - 50-day ROC: +nan%

Oil/Gold:
  - Component score: 5.0/100
  - Current value: nan
  - Position vs EMA50: BELOW
  - 20-day ROC: +nan%
  - 50-day ROC: +nan%
  → Declining energy demand

SP500/VIX:
  - Component score: 5.0/100
  - Current value: nan
  - Position vs EMA50: BELOW
  - 20-day ROC: +nan%
  - 50-day ROC: +nan%

Commodities/T30y:
  - Component score: 5.0/100
  - Current value: nan
  - Position vs EMA50: BELOW
  - 20-day ROC: +nan%
  - 50-day ROC: +nan%
  → Expectations of slowdown

SP500/Nasdaq:
  - Component score: 5.0/100
  - Current value: nan
  - Position vs EMA50: BELOW
  - 20-day ROC: +nan%
  - 50-day ROC: +nan%

============================================================
CONCLUSIONS AND RECOMMENDATIONS
============================================================

The market is in bearish territory. Signs of widespread stress.
Ongoing flight from risk. Maximum caution advised.
Positioning: VERY DEFENSIVE, capital preservation.


STRONGEST RATIOS:
  • DJ/Gold: 5.0/100
  • Gold/USD: 5.0/100
  • Oil/Gold: 5.0/100

WEAKEST RATIOS:
  • SP500/VIX: 5.0/100
  • Commodities/T30y: 5.0/100
  • SP500/Nasdaq: 5.0/100

============================================================
Analysis automatically generated by kbmeter.com
Date: 2026-03-19
📄 Detailed Asset Allocation Analysis
ASSET ALLOCATION & REGIME ANALYSIS - 2026-03-19
======================================================================

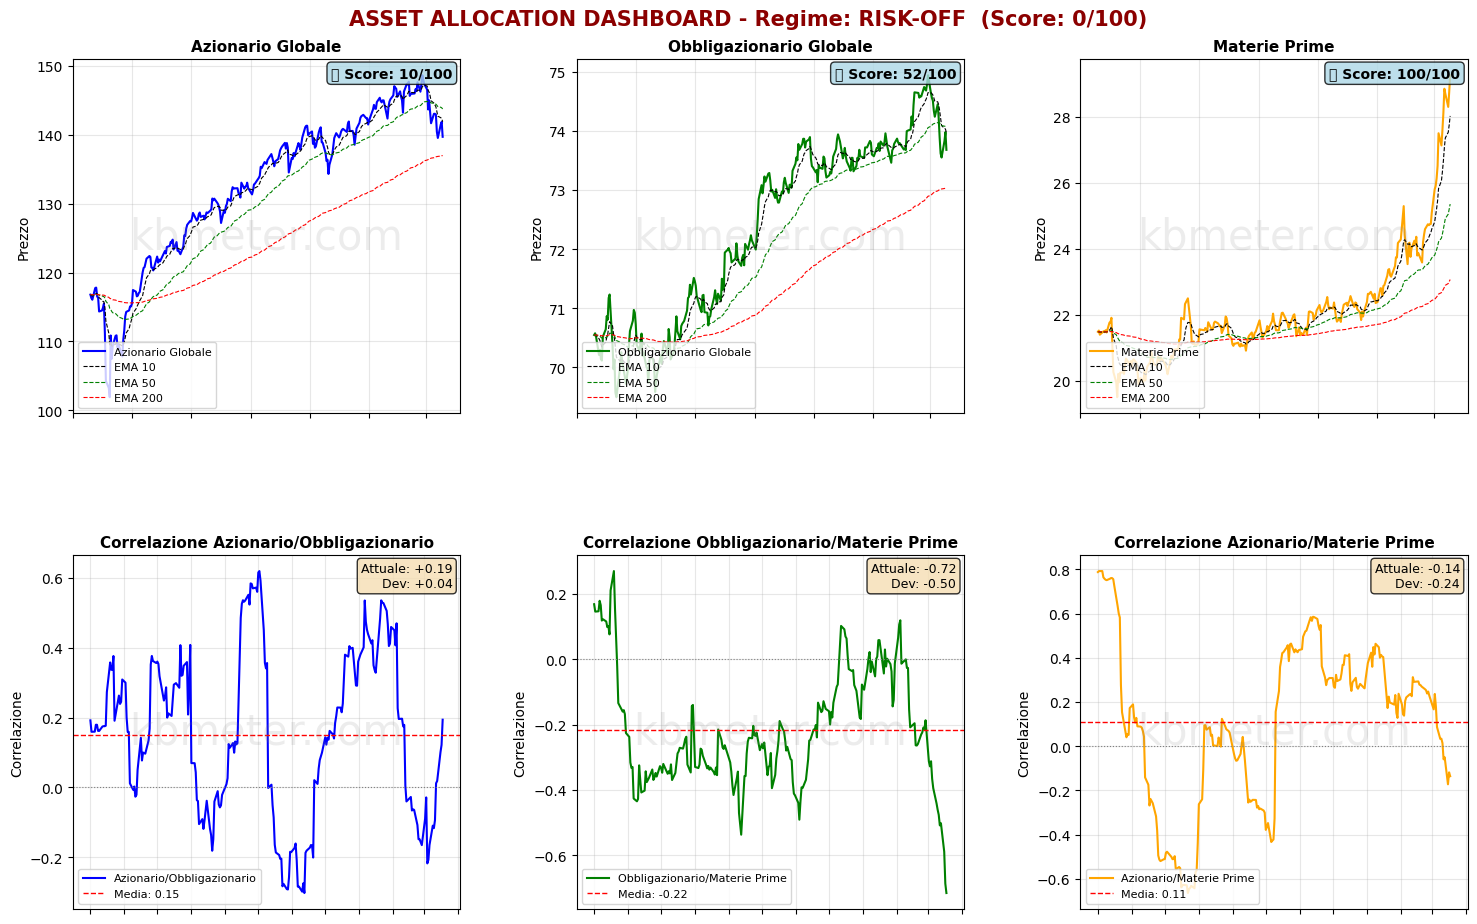
MARKET REGIME: RISK-OFF
REGIME SCORE: 0.0/100

======================================================================
TREND AND VOLATILITY ANALYSIS
======================================================================

GLOBAL EQUITIES (ACWI):
  Short-term Trend (5d): -0.53% | BELOW EMA 10
  Medium-term Trend (20d): -4.53% | BELOW EMA 50
  Long-term Trend (60d): -0.85% | ABOVE EMA 200

  Volatility 5d: 20.7%
  Volatility 20d: 15.7%
  Volatility 60d: 13.1%

COMMODITIES (DBC):
  Medium-term Trend (20d): +19.81% | ABOVE EMA 50
  Volatility 20d: 20.9%

Correlation ACWI/BND (30d): 0.194

REGIME INTERPRETATION:
The market is in a risk-off regime. Negative trends across multiple horizons and/or elevated volatility.
Flight to safe assets underway.
Suggested positioning: DEFENSIVE, capital protection.

======================================================================
ASSET RANKING - WHICH PERFORMS BEST?
======================================================================

🥇 1. Commodities (DBC) - SCORE: 100/100
     Price: $29.27
     Trend: ABOVE EMA10 | ABOVE EMA50 | ABOVE EMA200
     Performance: 5d +1.42% | 20d +19.81% | 60d +32.41%
     Volatility: 5d 26.7% | 20d 20.9% | 60d 22.4%
     Drawdown: 0.00%
     → Asset in STRONG CONDITION: positive trends and controlled volatility

🥈 2. Global Bonds (BND) - SCORE: 52/100
     Price: $73.68
     Trend: BELOW EMA10 | BELOW EMA50 | ABOVE EMA200
     Performance: 5d +0.08% | 20d -1.22% | 60d +0.15%
     Volatility: 5d 5.5% | 20d 3.9% | 60d 3.3%
     Drawdown: -1.68%
     → Asset in NEUTRAL condition: mixed signals

🥉 3. Global Equities (ACWI) - SCORE: 10/100
     Price: $139.71
     Trend: BELOW EMA10 | BELOW EMA50 | ABOVE EMA200
     Performance: 5d -0.53% | 20d -4.53% | 60d -0.85%
     Volatility: 5d 20.7% | 20d 15.7% | 60d 13.1%
     Drawdown: -6.01%
     → Asset in WEAK CONDITION: avoid or strongly underweight

======================================================================
CORRELATION ANALYSIS - CURRENT vs HISTORICAL
======================================================================

ACWI/BND:
  Current correlation (30d): +0.194
  Historical average (1 year): +0.151
  Deviation: +0.043
  → Weak correlation: moderate diversification

BND/DBC:
  Current correlation (30d): -0.716
  Historical average (1 year): -0.217
  Deviation: -0.499
  ⚠️ SIGNIFICANT DEVIATION from historical average

ACWI/DBC:
  Current correlation (30d): -0.136
  Historical average (1 year): +0.109
  Deviation: -0.245
  → Negative correlation: possible supply-driven shift

======================================================================
OPERATIONAL SUMMARY
======================================================================

STRONGEST ASSET: Commodities (Score: 100/100)
WEAKEST ASSET: Global Equities (Score: 10/100)

SUGGESTED ACTION: Reduce exposure to the weakest asset, favor defensive positioning.
DIVERSIFICATION: GOOD - Diversification benefits present.

======================================================================
Analysis automatically generated by kbmeter.com
Date: 2026-03-19
On the macro front, today features meetings from the BoJ (rates unchanged), the BoE, and the ECB. It is difficult to expect a rate cut from London in such an uncertain environment (even if current macro conditions would justify it). For the ECB, no action is expected. Among other relevant data, watch employment trends in the UK and Australia, as well as the Philly Fed index and U.S. data on unemployment claims and new home sales.
Already a subscriber? Login here
NOTES AND WARNINGS
Data compiled by kbmeter.com. Analysis date: 19 March 2026 - 7:42 AM GMT+1
This content is provided for informational purposes only and should not be considered financial advice. All scores and assessments are based on the previous trading day’s closing prices. Futures indications refer to the date and time of the analysis.