
Markets Weigh Anthropic’s Wall Street Debut Against Fed Rate Signals as Commodities Enter a Critical Phase
Financial markets remain in the same environment, with risk-off sentiment and volatility continuing to dominate. While the world turns its attention to the US-China-Russia trilateral meeting, investors are digesting the contents of the latest Fed minutes (with an interest rate hike becoming increasingly likely) and looking ahead to Anthropic’s debut on Wall Street. Gold continues to struggle, while commodities are entering a particularly delicate phase. Futures point to a positive opening in the US and a weaker start in Europe.
Market Weather Map
November 19, 2026
US Equities
Eu Equities
Asia Equities
Commodities
Bonds
Dollar Index
Technology
Gold
Oil
Crypto
Market Summary
Do you want to see the score details for all assets monitored by KBMeter?
Try free for 14 days →Financial markets sentiment
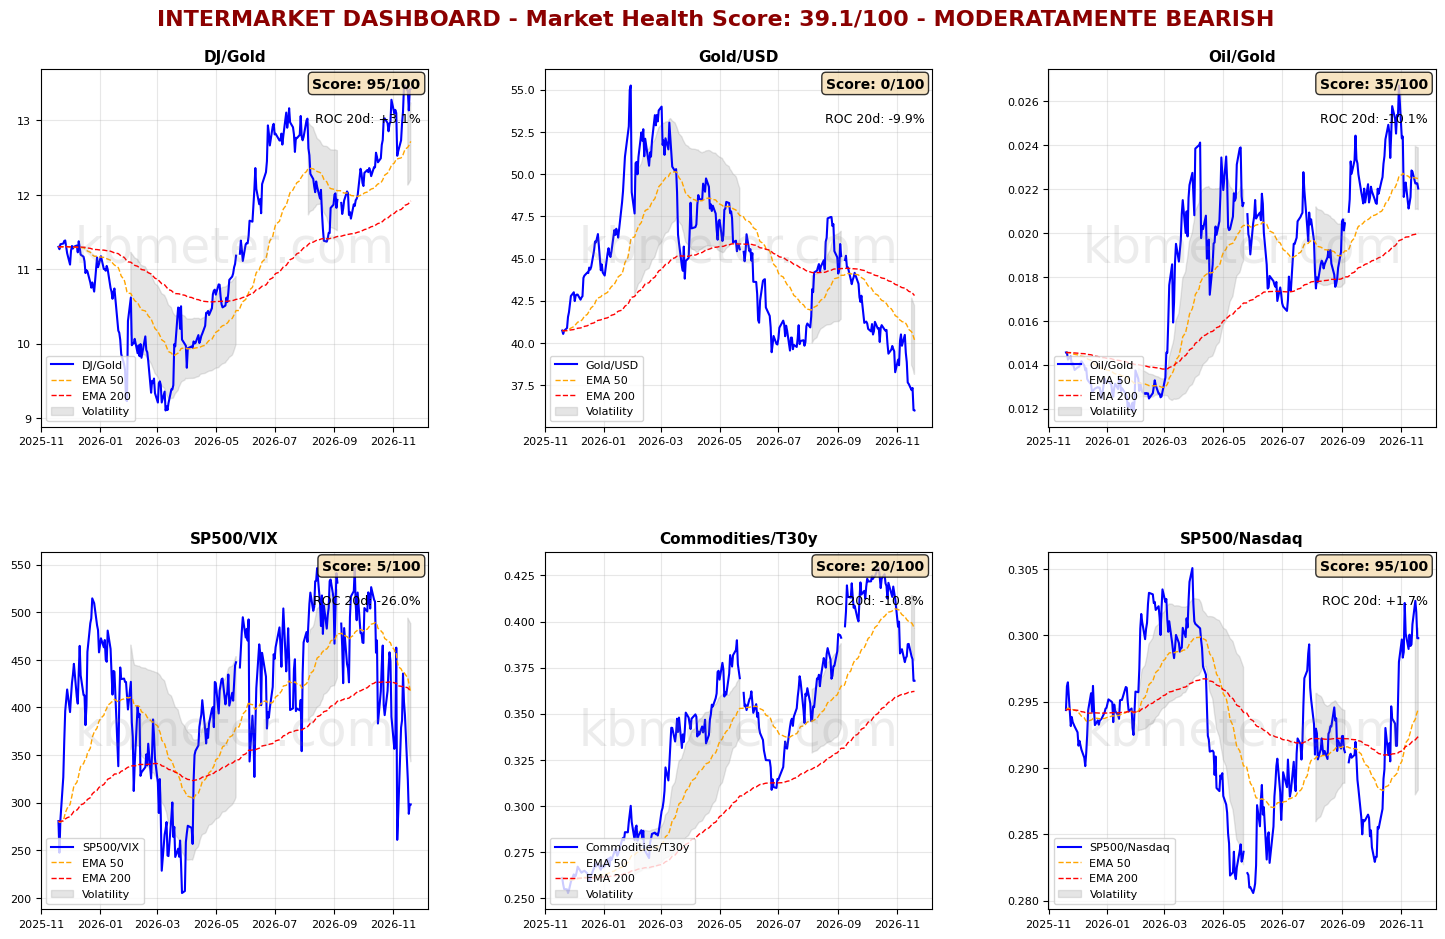
Financial markets are showing moderately negative sentiment today. Our intermarket analysis indicates a Market Health Score of 39/100. Two key developments stand out from our intermarket dashboards.
The first is sentiment, which remains very weak, weighed down by a technology sector that is no longer able to drive equity markets higher.
The second concerns the performance of gold and commodities. Bullion is coming under pressure from further indications of potential rate hikes by the Fed and is falling to new recent lows against the US dollar. Commodities are losing ground relative to long-term US Treasury bonds, with the ratio between the two asset classes approaching its long-term moving average. If inflation expectations remain elevated, an alternative explanation for this move could be a slowdown in economic growth. It is still too early to embrace this scenario, but we are flagging it as something to monitor and analyse over the coming weeks.
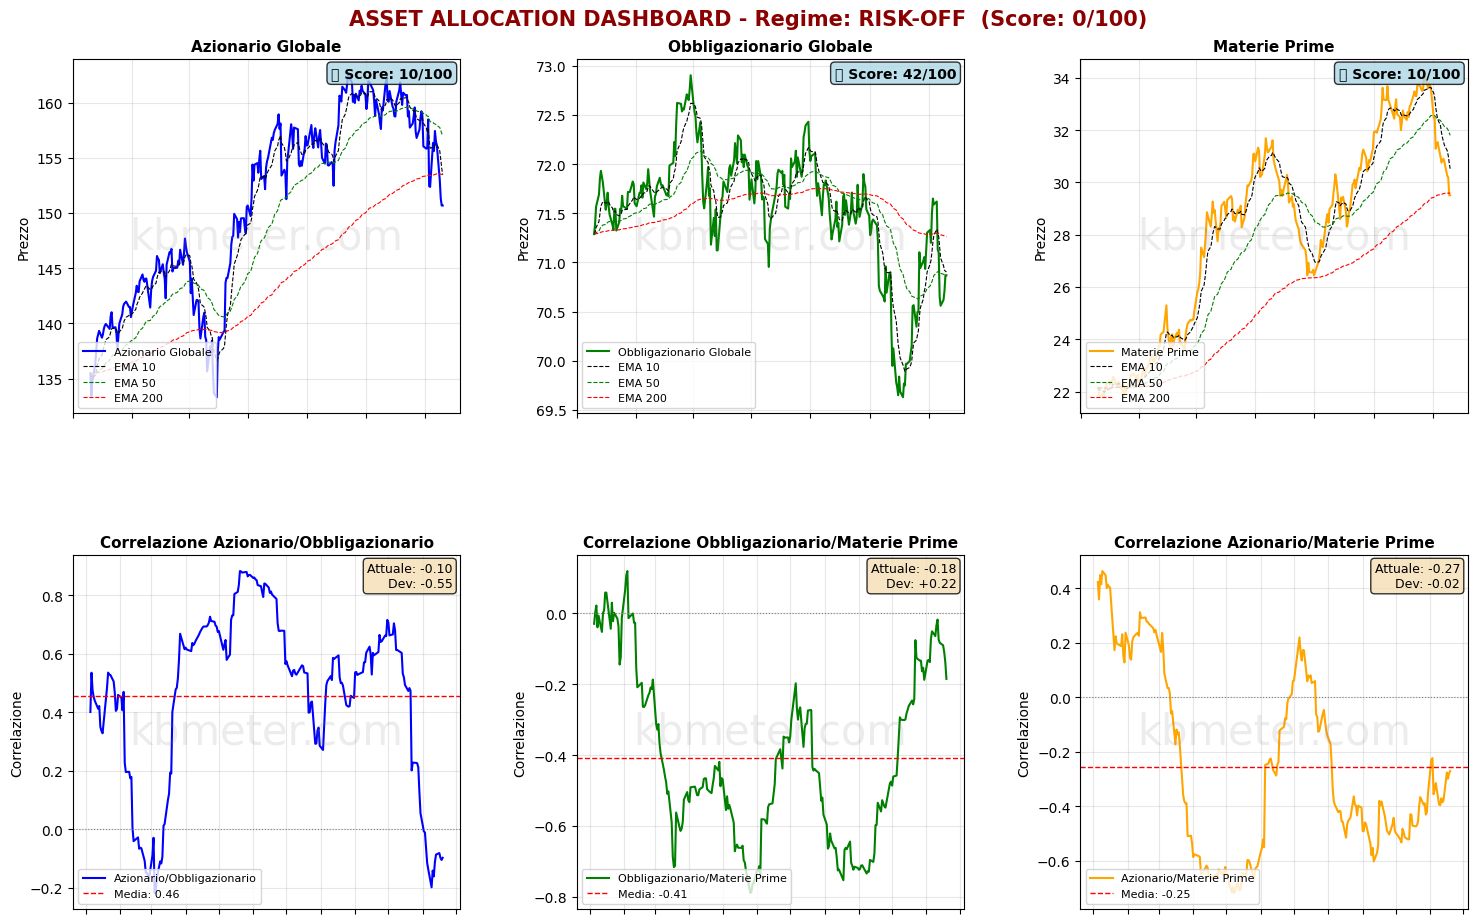
Looking at the various asset classes, commodities have confirmed their decline towards the long-term moving average, while global equities and global bonds are holding at the levels observed in previous analyses.
Our Market Weather Map continues to send a very clear message. The US dollar is strengthening, with its score moving above the 65-point threshold, while European equities, despite showing signs of weakening, remain the only other asset class monitored by the map to stay above the 50-point mark. Gold is showing clear weakness, while cryptocurrencies and oil are both hovering close to critical levels.
Global Futures – Pre-Market Sentiment
Pre-Market Futures: Global futures point to moderately risk-off sentiment (-0.20% on average), with US futures in positive territory (+0.72%), European futures slightly lower (-0.29%) and Asian futures also marginally negative (-0.11%).
📊 Global Futures – Pre-Market Sentiment
- US Tech 100: +1.07%
- Nikkei 225: +0.82%
- USA 500: +0.61%
- Taiwan: -3.84%
- Hang Seng: -1.31%
- FTSE MIB: -1.31%
Macroeconomic calendar
It is a relatively quiet day on the macroeconomic front. Key releases include Australian employment data, the latest US jobless claims figures and the Philadelphia Fed Manufacturing Index. Spanish and French government bond auctions will also be worth watching.
Assets to watch
Data as of Nov 19, 2026We have split the KBMeter scores into three bands, depending on their value: Weak, Intermediate or Strong. Here you can see which bands are most at risk of changing over the next 5 days and which ones hold.
The number on the right is the share of similar past cases in which the band had changed after 5 days. The higher it is, the more likely it is to change. The arrow in the current band appears when the asset is close to the border with the neighbouring band.
CONTINUE READING. ACTIVATE YOUR 14-DAY FREE TRIAL NOW. CLICK HERE
Already a subscriber? Login here
It does not say whether the price will rise or fall and it is not investment advice.
Already a subscriber? Login here
NOTES AND WARNINGS
Data compiled by kbmeter.com. Analysis date: 19 November 2026 - 8:40 AM GMT+1
This content is provided for informational purposes only and should not be considered financial advice. All scores and assessments are based on the previous trading day’s closing prices. Futures indications refer to the date and time of the analysis.