
Markets Turn Cautious Despite Earnings, as Oil and Dollar Strengthen on Risk-Off Signals
Caution. This seems to be the key word for financial markets in recent days, amid a stream of conflicting news. Strong quarterly results from technology companies have failed to lift market sentiment, while developments in the Middle East are fueling concerns. As a result, overall sentiment remains between neutral and moderately negative, with our barometer signaling a risk-off environment. Asian equities remain weak, as does gold, while bonds continue to trade in neutral territory. Futures point to a negative opening in the US and a flat start in Europe.
Market Weather Map
October 22, 2026
US Equities
Eu Equities
Asia Equities
Commodities
Bonds
Dollar Index
Technology
Gold
Oil
Crypto
Market Summary
Do you want to see the score details for all assets monitored by KBMeter?
Try free for 14 days →Financial markets sentiment
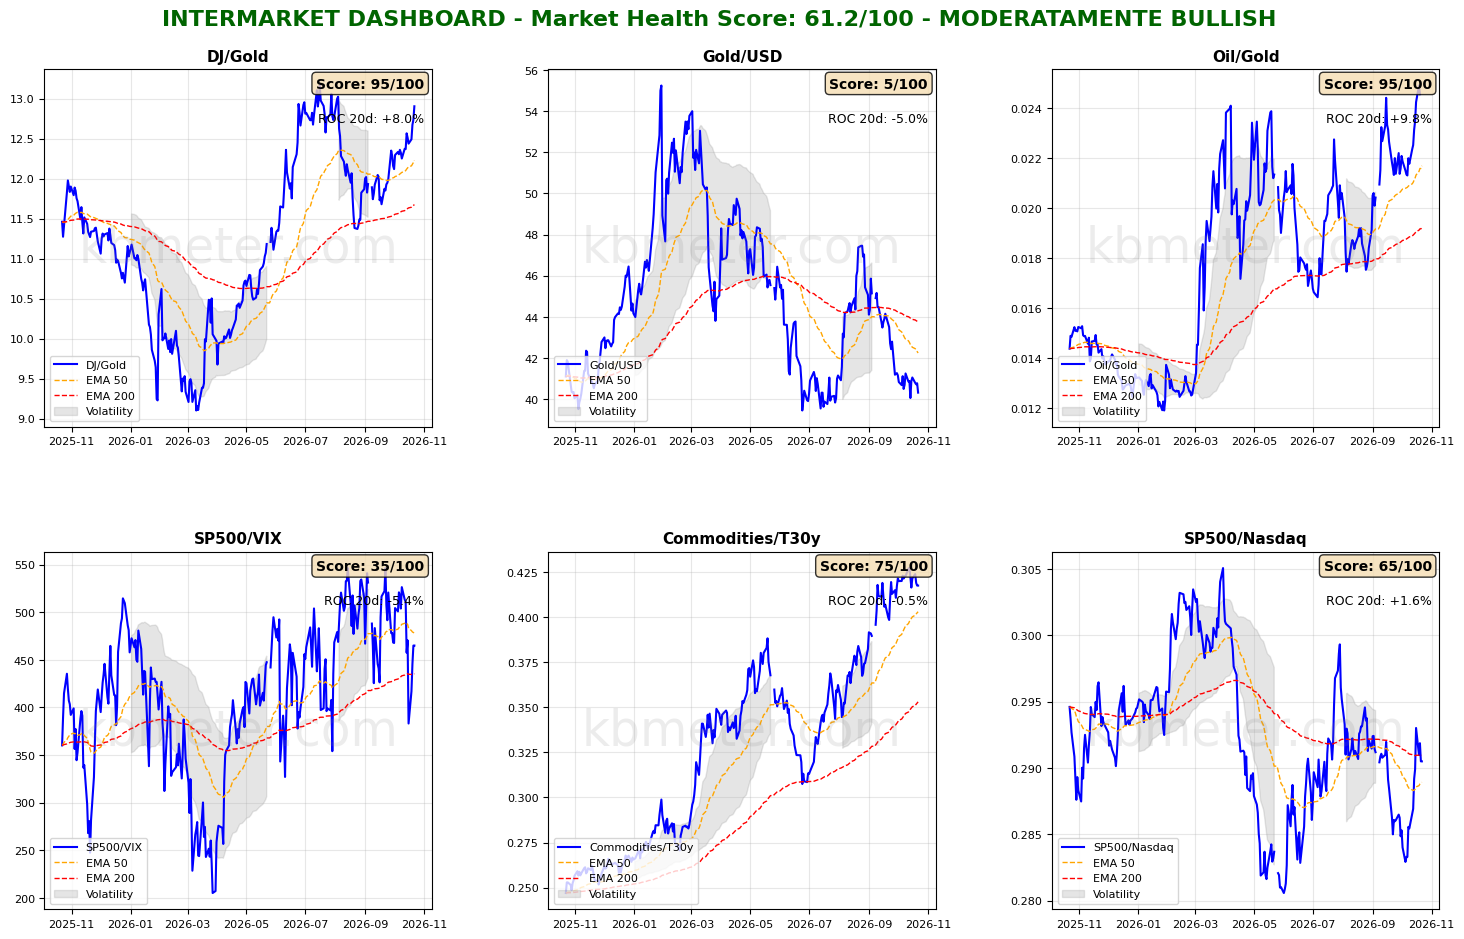
Financial markets are currently showing neutral to moderately negative sentiment. Our intermarket analysis records a Market Health Score of 61/100.
Our intermarket dashboards continue to point to a broadly cautious market environment, with several factors worth monitoring closely. The S&P 500/VIX ratio remains stable, trading slightly above its long-term moving average. The S&P 500/Nasdaq ratio is testing its long-term moving average, a level from which it could potentially rebound.
Apparently contradictory moves are emerging in the Dow/Gold and Commodities/Bonds ratios. The former is accelerating to the upside, although this move is largely driven by falling gold prices. The latter is attempting to establish a short-term sideways trend while remaining near its period highs. Oil is strengthening against gold, with the ratio reaching new period highs.
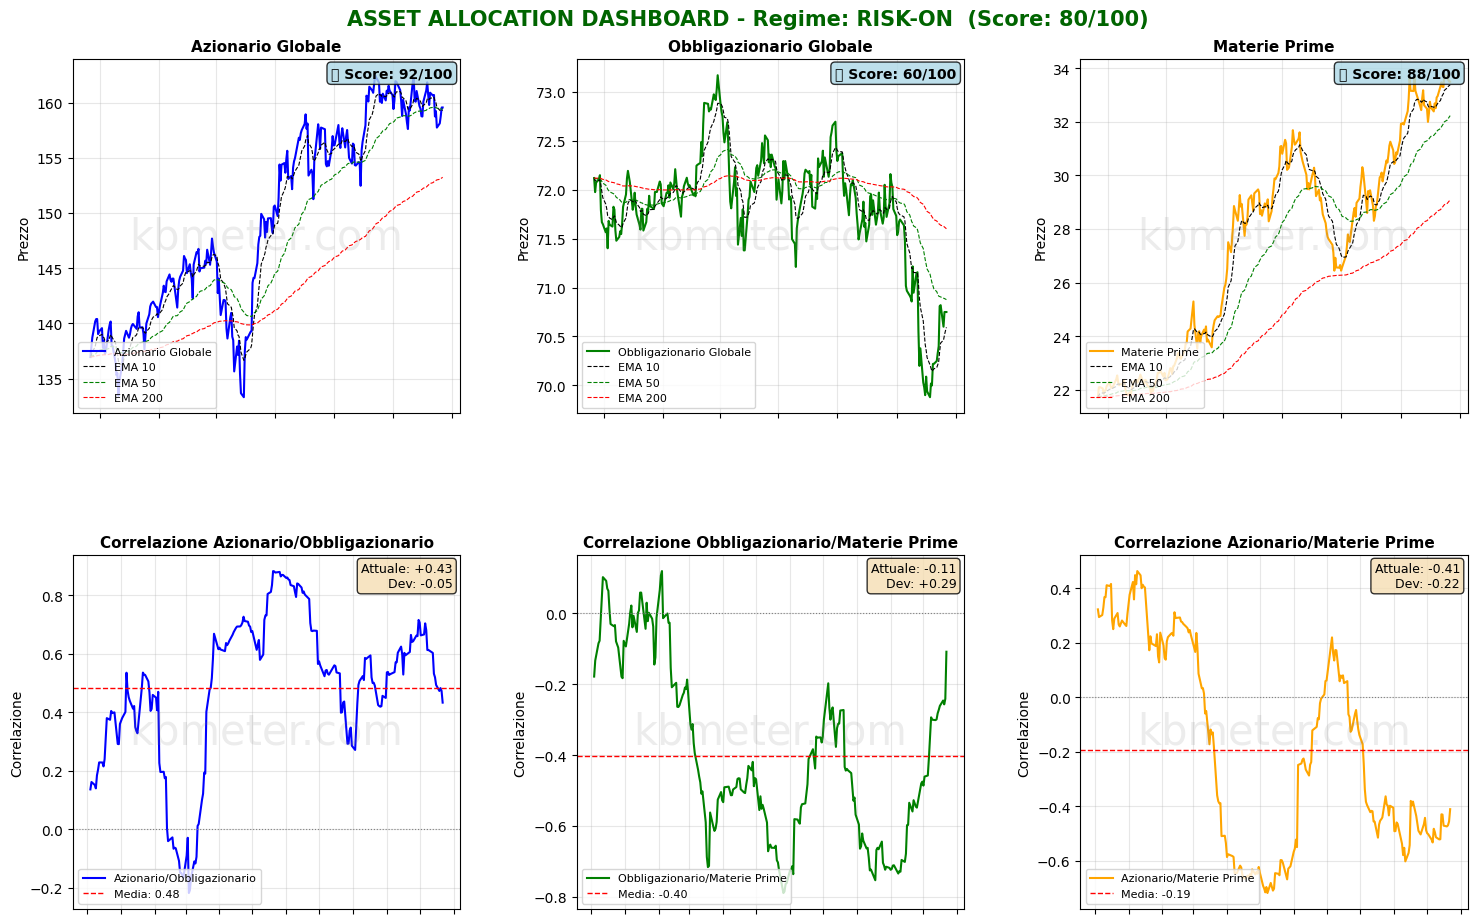
What is happening? Market sentiment appears to be shifting towards a risk-off stance, bringing US Treasuries and the US dollar back into focus as safe havens. Gold is being weighed down by the dollar’s strength, while equities remain in limbo, struggling to find direction in the absence of strong leadership from the technology sector.
Looking at the various asset classes, the trends identified in previous analyses remain broadly confirmed. Global bonds remain under close observation, as prices are currently trapped between their short- and medium-term moving averages.
The picture is also broadly unchanged in our market weather map. Equities remain in neutral territory, with Asia and the technology sector showing greater weakness. Bonds are holding at a score of 52, while oil and the US dollar remain the two highest-rated assets.
Global Futures – Pre-Market Sentiment
Pre-Market Futures: Global futures point to a risk-off sentiment, with an average decline of 0.62%. US futures are down 0.73%, European futures are slightly positive at +0.11%, while Asian futures are sharply lower at -1.89%.
📊 Global Futures – Pre-Market Sentiment
- FTSE MIB: +0.99%
- IBEX 35: +0.75%
- CAC 40: +0.74%
- Hang Seng: -2.66%
-
Nikkei 225: <
Macroeconomic calendar
On the macroeconomic front, today’s calendar offers relatively few market-moving catalysts. Key releases include the latest consumer confidence survey for the euro area, industrial orders data from the UK, and the latest US jobless claims figures.
As for corporate earnings, the spotlight will be on P&G, Western Digital, Nestlé, Spotify, Barclays, and Hermès.
Assets to watch
Data as of Oct 21, 2026We have split the KBMeter scores into three bands, depending on their value: Weak, Intermediate or Strong. Here you can see which bands are most at risk of changing over the next 5 days and which ones hold.
The number on the right is the share of similar past cases in which the band had changed after 5 days. The higher it is, the more likely it is to change. The arrow in the current band appears when the asset is close to the border with the neighbouring band.
CONTINUE READING. ACTIVATE YOUR 14-DAY FREE TRIAL NOW. CLICK HERE
Already a subscriber? Login here
It does not say whether the price will rise or fall and it is not investment advice.
Already a subscriber? Login here
NOTES AND WARNINGS
Data compiled by kbmeter.com. Analysis date: 22 October 2026 - 8:22 AM GMT+1
This content is provided for informational purposes only and should not be considered financial advice. All scores and assessments are based on the previous trading day’s closing prices. Futures indications refer to the date and time of the analysis.