
Markets Split in Two: Rate Expectations Boost Dollar as Falling Oil Supports European Equities
The week in financial markets continues to revolve around two main themes. On the one hand, interest rate expectations have pushed the US dollar back above a score of 60, while putting renewed pressure on gold. On the other, European equities are benefiting from a more favourable monetary policy outlook and falling oil prices.
In the technology sector, which remains below the 50-point score threshold, uncertainty persists. The Nvidia story is overshadowing the more optimistic news surrounding Anthropic’s IPO and CoreWeave’s outlook.
Futures point to a negative opening in the US and a positive start in Europe.
Market Weather Map
November 12, 2026
US Equities
Eu Equities
Asia Equities
Commodities
Bonds
Dollar Index
Technology
Gold
Oil
Crypto
Market Summary
Do you want to see the score details for all assets monitored by KBMeter?
Try free for 14 days →Financial markets sentiment
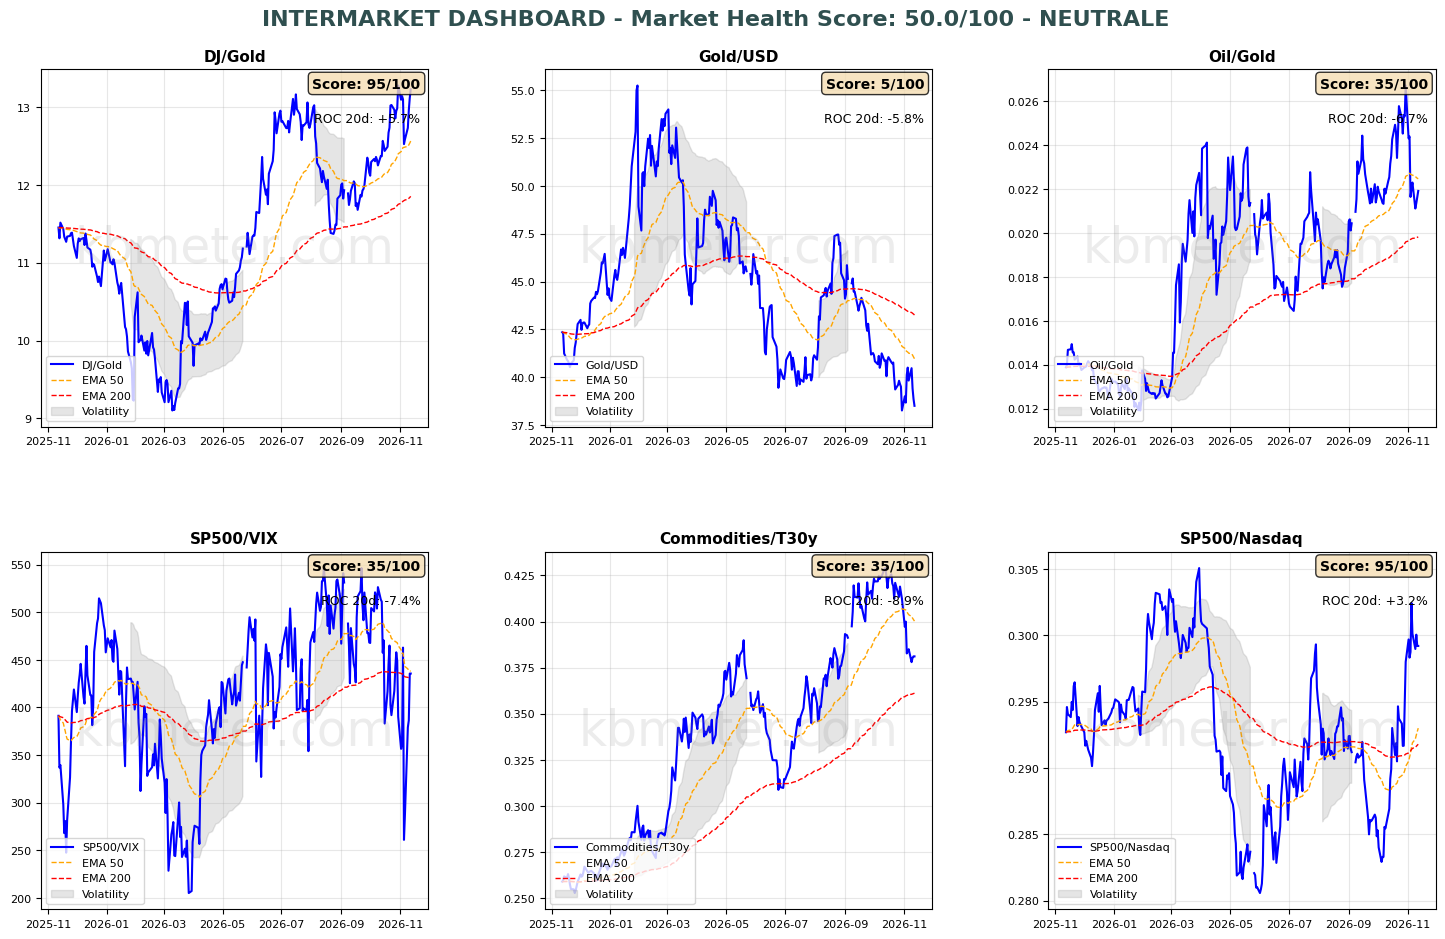
Financial markets are currently showing a neutral sentiment. Intermarket analysis highlights a Market Health Score of 50/100. Our dashboards continue to indicate an overall neutral environment, although there are some signs of improvement in risk appetite.
The S&P 500/VIX ratio has moved back above its long-term moving average, while the Dow Jones/Gold ratio has reached new period highs, benefiting from gold’s renewed decline. The technology sector remains at a crossroads: the S&P 500/Nasdaq ratio has stabilised at recent levels and remains comfortably above its long-term moving average, confirming its bullish crossover above the medium-term moving average.
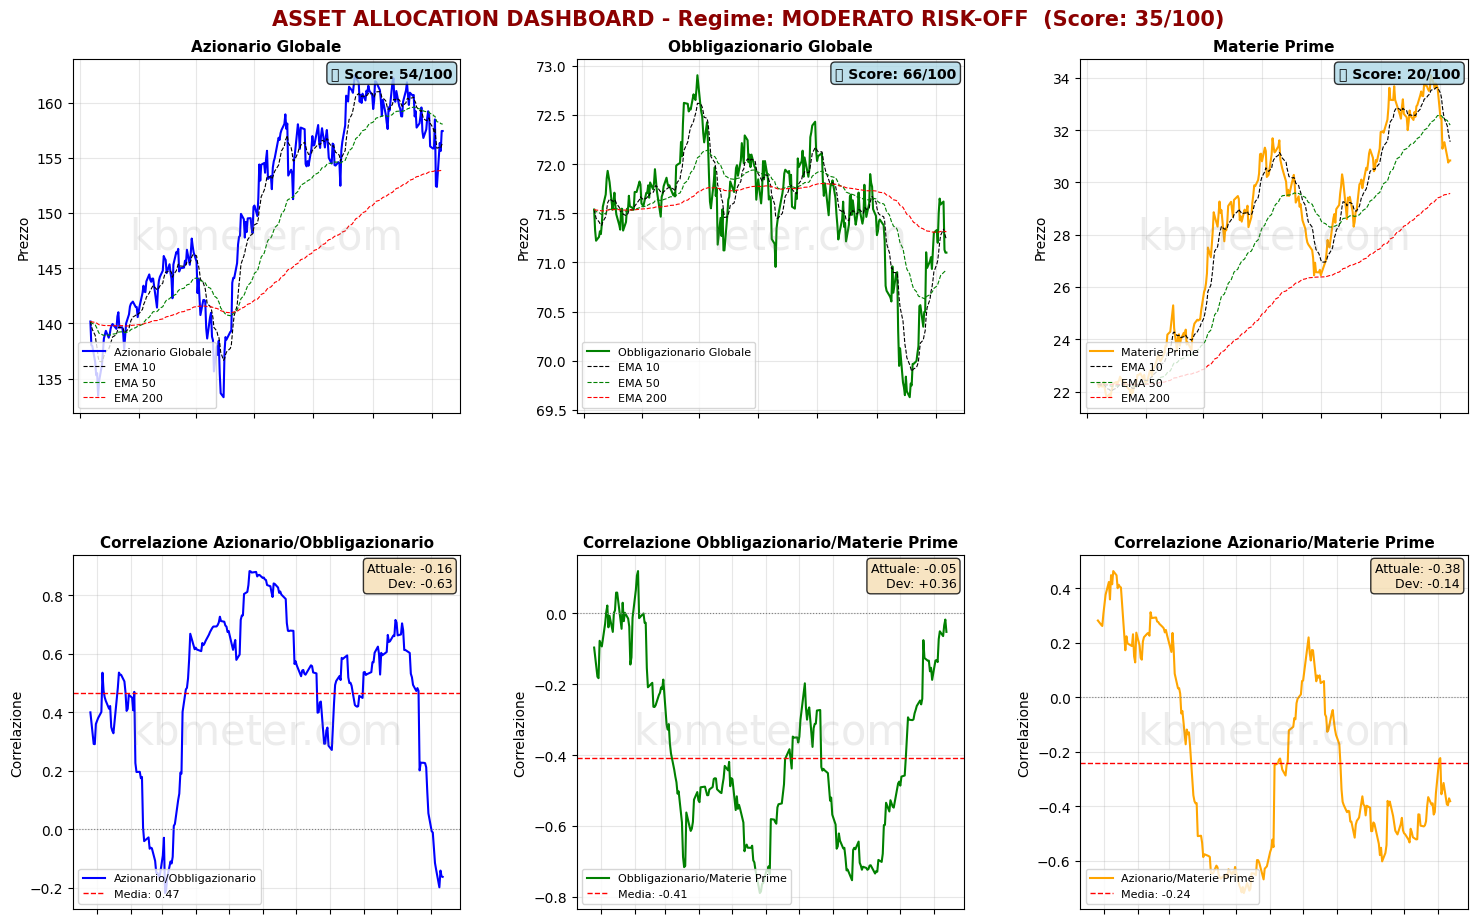
There have been few changes across asset classes. Global bonds remain below the resistance represented by the long-term moving average, while equities continue to trade below their medium-term moving average, maintaining signs of short-term weakness. Commodities are also losing ground, led by oil and gold.
Our market weather map points to a financial market environment moving in two different directions: interest rate expectations are supporting the US dollar and weighing on gold, while falling oil prices are improving the outlook for European equities.
Global Futures – Pre-Market Sentiment
Pre-Market Futures: Global futures point to a moderate risk-off sentiment (-0.27% on average), with the US in negative territory (-0.63%), Europe slightly positive (+0.44%) and Asia down (-0.59%).
📊 Global Futures – Pre-Market Sentiment
- CAC 40: +0.84%
- DAX: +0.61%
- FTSE MIB: +0.51%
- Taiwan: -3.65%
- Nikkei 225: -2.03%
- US Tech 100: -1.15%
Macroeconomic calendar
As for today’s macroeconomic agenda, markets will be focusing on UK economic activity figures for October, US existing home sales and the latest update on initial jobless claims. Attention will also turn to the ECB’s Economic Bulletin.
Assets to watch
Data as of Nov 11, 2026We have split the KBMeter scores into three bands, depending on their value: Weak, Intermediate or Strong. Here you can see which bands are most at risk of changing over the next 5 days and which ones hold.
The number on the right is the share of similar past cases in which the band had changed after 5 days. The higher it is, the more likely it is to change. The arrow in the current band appears when the asset is close to the border with the neighbouring band.
CONTINUE READING. ACTIVATE YOUR 14-DAY FREE TRIAL NOW. CLICK HERE
Already a subscriber? Login here
It does not say whether the price will rise or fall and it is not investment advice.
Already a subscriber? Login here
NOTES AND WARNINGS
Data compiled by kbmeter.com. Analysis date: 12 November 2026 - 9:01 AM GMT+1
This content is provided for informational purposes only and should not be considered financial advice. All scores and assessments are based on the previous trading day’s closing prices. Futures indications refer to the date and time of the analysis.