Markets Look Past U.S. Inflation Data as Focus Shifts to U.S.-China Summit
April 2026 data in the United States reinforces financial market expectations regarding inflation and interest rates, particularly following the approval of Warsh’s appointment to the Fed board. Sentiment nevertheless remains in positive territory, with the impression that markets are attempting to move away from a purely headline-driven logic. Attention is focused on the upcoming US-China summit and the possible implications of the meeting for developments in the Middle East as well. Futures point to a slightly negative opening for Europe and a positive one for the United States.
Market Weather Map
May 13, 2026
US Equities
Eu Equities
Asia Equities
Commodities
Bonds
Dollar Index
Technology
Gold
Oil
Crypto
Market Summary
Financial markets sentiment
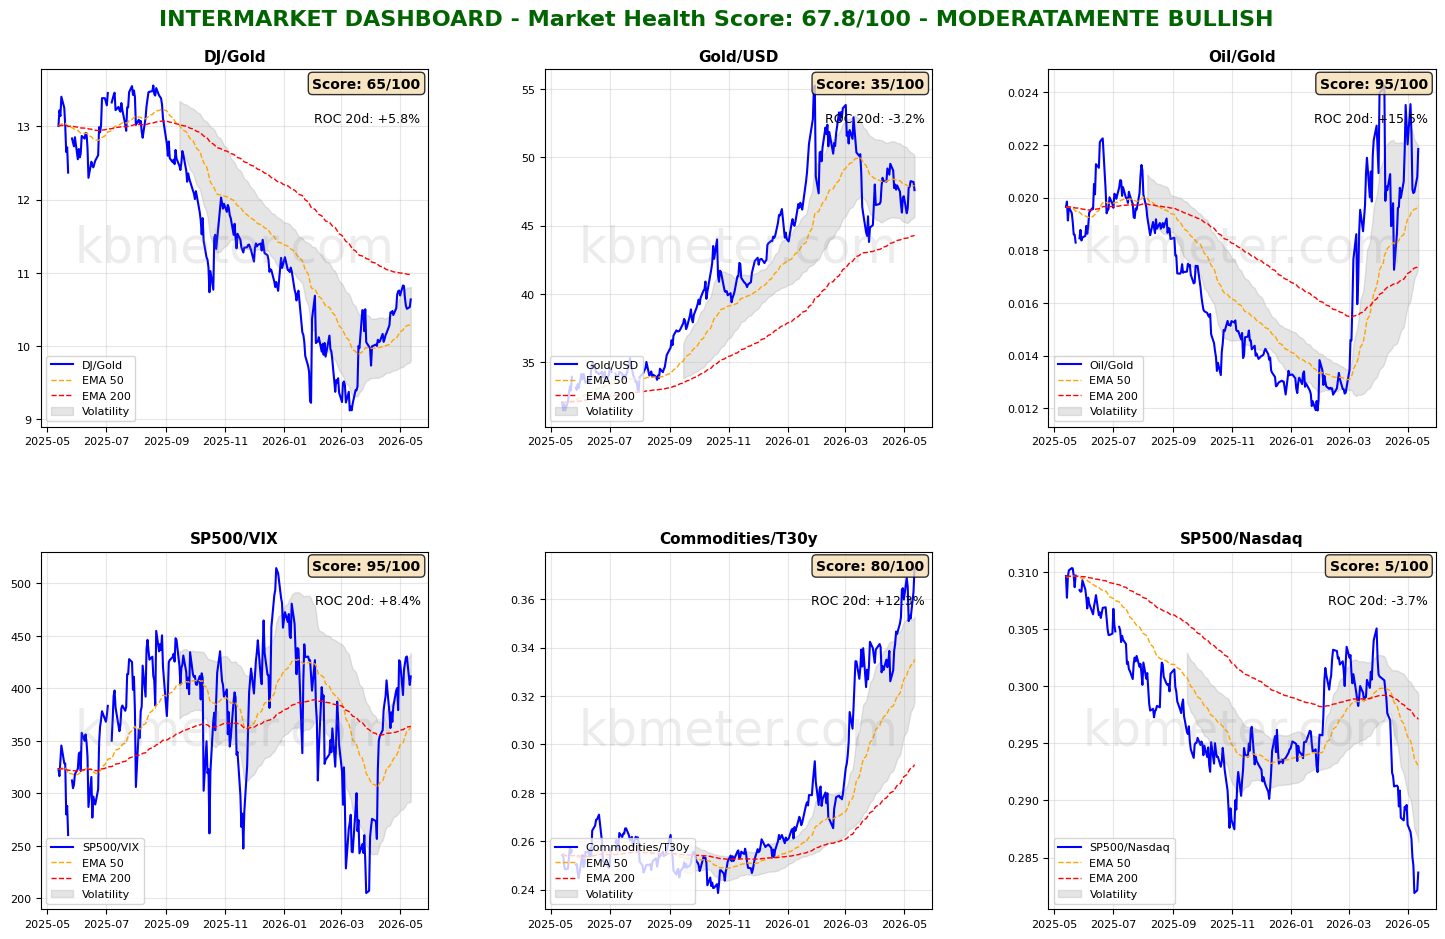
Financial markets currently show a neutral to moderately positive sentiment. Intermarket analysis highlights a Market Health Score of 68/100, indicating a moderately positive environment. Our intermarket dashboards show that recent developments — namely rising tensions between the United States and Iran and higher-than-expected US inflation data — have not substantially altered the overall picture regarding investor sentiment. Expectations of persistent inflation had already been reflected in the Commodities/Treasury ratio, which has consistently remained near the highs of the period, while risk appetite indicators continue to stay in positive territory.
The overall impression is that markets, having now largely priced in a scenario of higher interest rates and inflation, are gradually freeing themselves from a headline-driven dynamic, maintaining caution but also retaining a constructive stance on profits and economic growth.
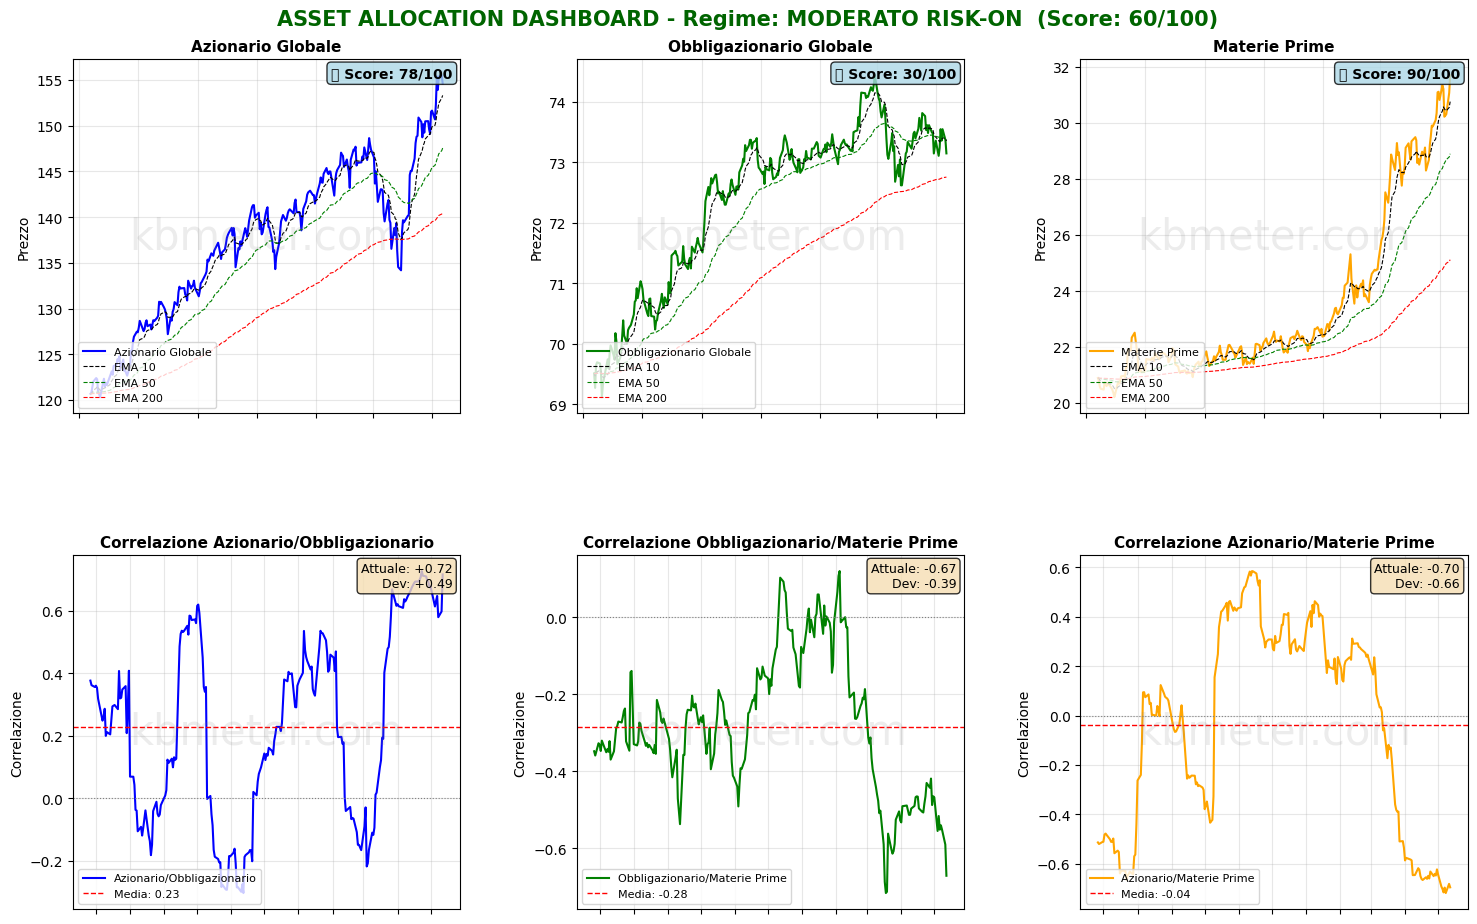
Asset class analysis confirms this view. Global equities remain above both short- and medium-term moving averages, while fixed income continues to trade just below the medium-term moving average threshold. Correlation between the two asset classes remains positive and close to period highs. Commodities continue to trend upward and remain negatively correlated with both equities and bonds.
Global Futures – Pre-Market Sentiment
Pre-market futures indicate a moderate risk-on sentiment globally, with an average gain of +0.11%: US futures are slightly positive (+0.22%), European futures slightly negative (-0.08%), and Asian futures positive (+0.52%).
📊 Global Futures – Pre-Market Sentiment
- Nikkei 225 derived: +1.32%
- Euro Stoxx 50 derived: +0.86%
- DAX derived: +0.71%
- TecDAX derived: -1.42%
- FTSE MIB derived: -1.40%
- IBEX 35 derived: -1.05%
Intermarket details
📄 Detailed Intermarket Analysis
INTERMARKET ANALYSIS - 2026-05-13
============================================================

MARKET HEALTH SCORE: 67.8/100
SENTIMENT: MODERATELY BULLISH

============================================================
SUMMARY OF KEY RATIOS
============================================================


DJ/Gold:
  - Component score: 65.0/100
  - Current value: 10.6381
  - Position vs EMA50: ABOVE
  - 20-day ROC: +5.75%
  - 50-day ROC: +15.17%
  → Preference for risk assets over safe havens

Gold/USD:
  - Component score: 35.0/100
  - Current value: 47.5898
  - Position vs EMA50: BELOW
  - 20-day ROC: -3.22%
  - 50-day ROC: -11.57%

Oil/Gold:
  - Component score: 95.0/100
  - Current value: 0.0218
  - Position vs EMA50: ABOVE
  - 20-day ROC: +15.47%
  - 50-day ROC: +62.37%
  → Rising energy demand

SP500/VIX:
  - Component score: 95.0/100
  - Current value: 411.3930
  - Position vs EMA50: ABOVE
  - 20-day ROC: +8.41%
  - 50-day ROC: +28.17%
  → Expanding risk appetite

Commodities/T30y:
  - Component score: 80.0/100
  - Current value: 0.3729
  - Position vs EMA50: ABOVE
  - 20-day ROC: +12.34%
  - 50-day ROC: +28.47%
  - ⚠️ ANOMALY DETECTED - Significant deviation from the average
  → Economic growth expectations

SP500/Nasdaq:
  - Component score: 5.0/100
  - Current value: 0.2837
  - Position vs EMA50: BELOW
  - 20-day ROC: -3.75%
  - 50-day ROC: -6.22%

============================================================
CONCLUSIONS AND RECOMMENDATIONS
============================================================

The market remains moderately constructive. Some ratios are showing positive signals,
but elements of caution persist. Monitor developments closely.
Positioning: SELECTIVE, favor quality.


STRONGEST RATIOS:
  • Oil/Gold: 95.0/100
  • SP500/VIX: 95.0/100
  • Commodities/T30y: 80.0/100

WEAKEST RATIOS:
  • DJ/Gold: 65.0/100
  • Gold/USD: 35.0/100
  • SP500/Nasdaq: 5.0/100

============================================================
Data processed by kbmeter.com
Date: 2026-05-13
📄 Detailed Asset Allocation Analysis
ASSET ALLOCATION & REGIME ANALYSIS - 2026-05-13
======================================================================

MARKET REGIME: MODERATE RISK-ON
REGIME SCORE: 60.0/100

======================================================================
TREND AND VOLATILITY ANALYSIS
======================================================================

GLOBAL EQUITIES (ACWI):
  Short-Term Trend (5d): -0.48% | ABOVE EMA 10
  Medium-Term Trend (20d): +3.93% | ABOVE EMA 50
  Long-Term Trend (60d): +5.92% | ABOVE EMA 200

  5d Volatility: 18.9%
  20d Volatility: 14.2%
  60d Volatility: 17.7%

COMMODITIES (DBC):
  Medium-Term Trend (20d): +9.69% | ABOVE EMA 50
  20d Volatility: 24.0%

ACWI/BND Correlation (30d): 0.717

REGIME INTERPRETATION:
The market shows risk appetite, although some elements of caution remain.
The trend is constructive, but conflicting signals may emerge across certain time horizons.
Suggested positioning: BALANCED with a slight tilt toward risk assets.

======================================================================
ASSET RANKING - WHICH IS PERFORMING BEST?
======================================================================

🥇 1. Commodities (DBC) - SCORE: 90/100
     Price: $31.69
     Trend: ABOVE EMA10 | ABOVE EMA50 | ABOVE EMA200
     Performance: 5d +4.90% | 20d +9.69% | 60d +34.34%
     Volatility: 5d 35.5% | 20d 24.0% | 60d 24.6%
     Drawdown: 0.00%
     → Asset in STRONG HEALTH: positive trends and controlled volatility

🥈 2. Global Equities (ACWI) - SCORE: 78/100
     Price: $154.65
     Trend: ABOVE EMA10 | ABOVE EMA50 | ABOVE EMA200
     Performance: 5d -0.48% | 20d +3.93% | 60d +5.92%
     Volatility: 5d 18.9% | 20d 14.2% | 60d 17.7%
     Drawdown: -0.57%
     → Asset in STRONG HEALTH: positive trends and controlled volatility

🥉 3. Global Bonds (BND) - SCORE: 30/100
     Price: $73.15
     Trend: BELOW EMA10 | BELOW EMA50 | ABOVE EMA200
     Performance: 5d -0.54% | 20d -0.66% | 60d -1.34%
     Volatility: 5d 5.4% | 20d 4.0% | 60d 4.3%
     Drawdown: -1.74%
     → Asset in WEAK CONDITIONS: negative trends or elevated volatility

======================================================================
CORRELATION ANALYSIS - CURRENT vs HISTORICAL
======================================================================

ACWI/BND:
  Current correlation (30d): +0.717
  Historical average (1 year): +0.228
  Deviation: +0.488
  ⚠️ SIGNIFICANT DEVIATION from historical average
  → Positive correlation: diversification COMPROMISED

BND/DBC:
  Current correlation (30d): -0.671
  Historical average (1 year): -0.284
  Deviation: -0.387
  ⚠️ SIGNIFICANT DEVIATION from historical average

ACWI/DBC:
  Current correlation (30d): -0.695
  Historical average (1 year): -0.038
  Deviation: -0.657
  ⚠️ SIGNIFICANT DEVIATION from historical average
  → Negative correlation: possible supply-driven shift

======================================================================
OPERATIONAL SUMMARY
======================================================================

STRONGEST ASSET: Commodities (Score: 90/100)
WEAKEST ASSET: Global Bonds (Score: 30/100)

SUGGESTED ACTION: Favor the strongest asset while maintaining risk exposure.
DIVERSIFICATION: POOR - Asset classes tend to move together.

======================================================================
Data processed by kbmeter.com
Date: 2026-05-13
Macroeconomic Calendar
On the macroeconomic front, today’s session features important data releases for the Eurozone — including the second estimate of Q1 2026 GDP growth, March 2026 industrial production, and employment data — as well as for the United States, where March 2026 producer price data will be released.
On the earnings front, today the spotlight is on Cisco Systems and Alibaba Group.
Already a subscriber? Login here
NOTES AND WARNINGS
Data compiled by kbmeter.com. Analysis date: 13 May 2026 - 7:46 AM GMT+1
This content is provided for informational purposes only and should not be considered financial advice. All scores and assessments are based on the previous trading day’s closing prices. Futures indications refer to the date and time of the analysis.