
Markets in focus: weak dollar, Fed decision and big tech earnings
Financial markets continue to navigate a cloud of uncertainty, keeping a close eye on the ongoing debasement trade, with gold holding firm and the US dollar weakening.
Against this backdrop, the day is set to gain momentum with the Federal Reserve’s policy decision—rates are widely expected to remain unchanged, but investors will be focused on guidance for the coming months—as well as the first heavyweight earnings releases from the tech sector, including Tesla, Meta and Microsoft. Futures point to a positive open for both European and US markets.
Market Weather Map
January 28, 2026
US Equities
Eu Equities
Asia Equities
Commodities
Bonds
Dollar Index
Technology
Gold
Oil
Crypto
Market Summary
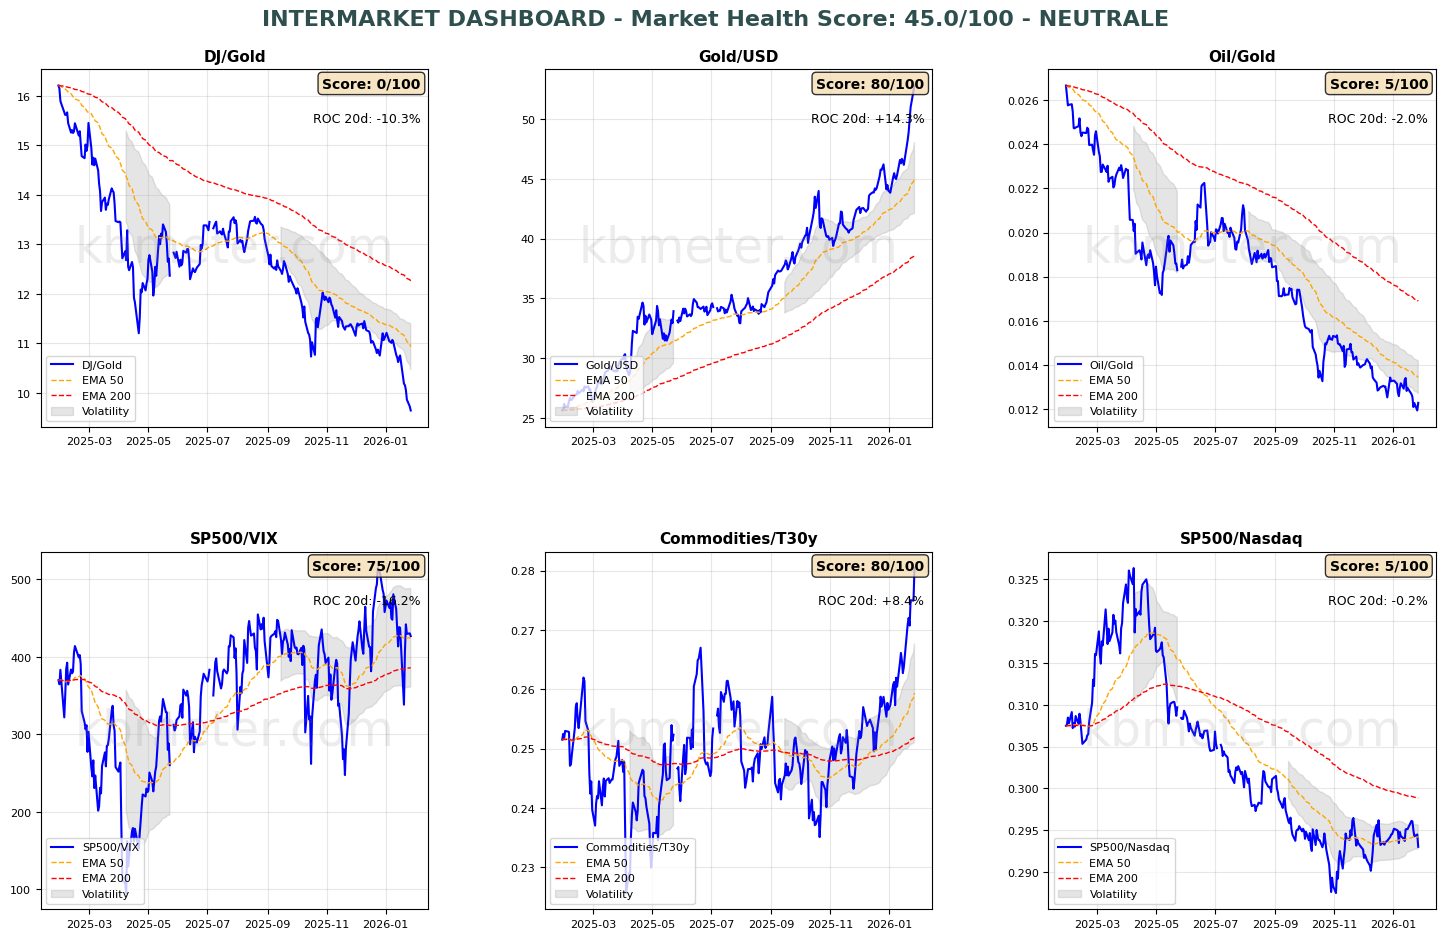
Overall, financial markets display a moderately positive sentiment today. Intermarket analysis shows a Market Health Score of 45/100, consistent with a neutral backdrop. Our intermarket dashboards continue to highlight the strength of gold, while risk indicators remain broadly stable. No significant shifts are evident across the three main asset classes, although it is worth noting that the equity/commodities correlation has returned to its annual average while remaining in positive territory.
Pre-market futures signal a moderate risk-on tone (+0.44% on average), with the US slightly positive (+0.42%), Europe modestly higher (+0.22%) and Asia clearly outperforming (+1.11%).
📊 Global Futures – Pre-Market Sentiment
- Hang Seng derived: +2.12%
- Nikkei 225 derived: +1.16%
- FTSE MIB derived: +1.08%
- TecDAX derived: -0.37%
- Euro Stoxx 50 derived: -0.02%
- Mini MDAX derived: +0.00%
📄 Detailed Intermarket Analysis
INTERMARKET ANALYSIS - 2026-01-28
============================================================

MARKET HEALTH SCORE: 45.0/100
SENTIMENT: NEUTRAL

============================================================
SUMMARY OF KEY RATIOS
============================================================


DJ/Gold:
  - Component score: 0.0/100
  - Current value: 9.6465
  - Position vs EMA50: BELOW
  - 20-day ROC: -10.31%
  - 50-day ROC: -15.95%
  - ⚠️ ANOMALY DETECTED - Significant deviation from the average
  → Flight to safe havens

Gold/USD:
  - Component score: 80.0/100
  - Current value: 52.7946
  - Position vs EMA50: ABOVE
  - 20-day ROC: +14.26%
  - 50-day ROC: +24.92%
  - ⚠️ ANOMALY DETECTED - Significant deviation from the average

Oil/Gold:
  - Component score: 5.0/100
  - Current value: 0.0123
  - Position vs EMA50: BELOW
  - 20-day ROC: -1.96%
  - 50-day ROC: -11.72%
  → Weakening energy demand

SP500/VIX:
  - Component score: 75.0/100
  - Current value: 426.8257
  - Position vs EMA50: ABOVE
  - 20-day ROC: -16.24%
  - 50-day ROC: +9.09%

Commodities/T30y:
  - Component score: 80.0/100
  - Current value: 0.2804
  - Position vs EMA50: ABOVE
  - 20-day ROC: +8.38%
  - 50-day ROC: +12.53%
  - ⚠️ ANOMALY DETECTED - Significant deviation from the average
  → Economic growth expectations

SP500/Nasdaq:
  - Component score: 5.0/100
  - Current value: 0.2930
  - Position vs EMA50: BELOW
  - 20-day ROC: -0.24%
  - 50-day ROC: +0.11%

============================================================
CONCLUSIONS AND RECOMMENDATIONS
============================================================

The market is in a neutral/sideways phase. Conflicting signals across the various ratios.
There is no clear direction. Wait for confirmation.
Positioning: BALANCED, avoid excesses.


STRONGEST RATIOS:
  • Gold/USD: 80.0/100
  • Commodities/T30y: 80.0/100
  • SP500/VIX: 75.0/100

WEAKEST RATIOS:
  • Oil/Gold: 5.0/100
  • SP500/Nasdaq: 5.0/100
  • DJ/Gold: 0.0/100

============================================================
Analysis automatically generated by kbmeter.com
Date: 2026-01-28
📄 Detailed Asset Allocation Analysis
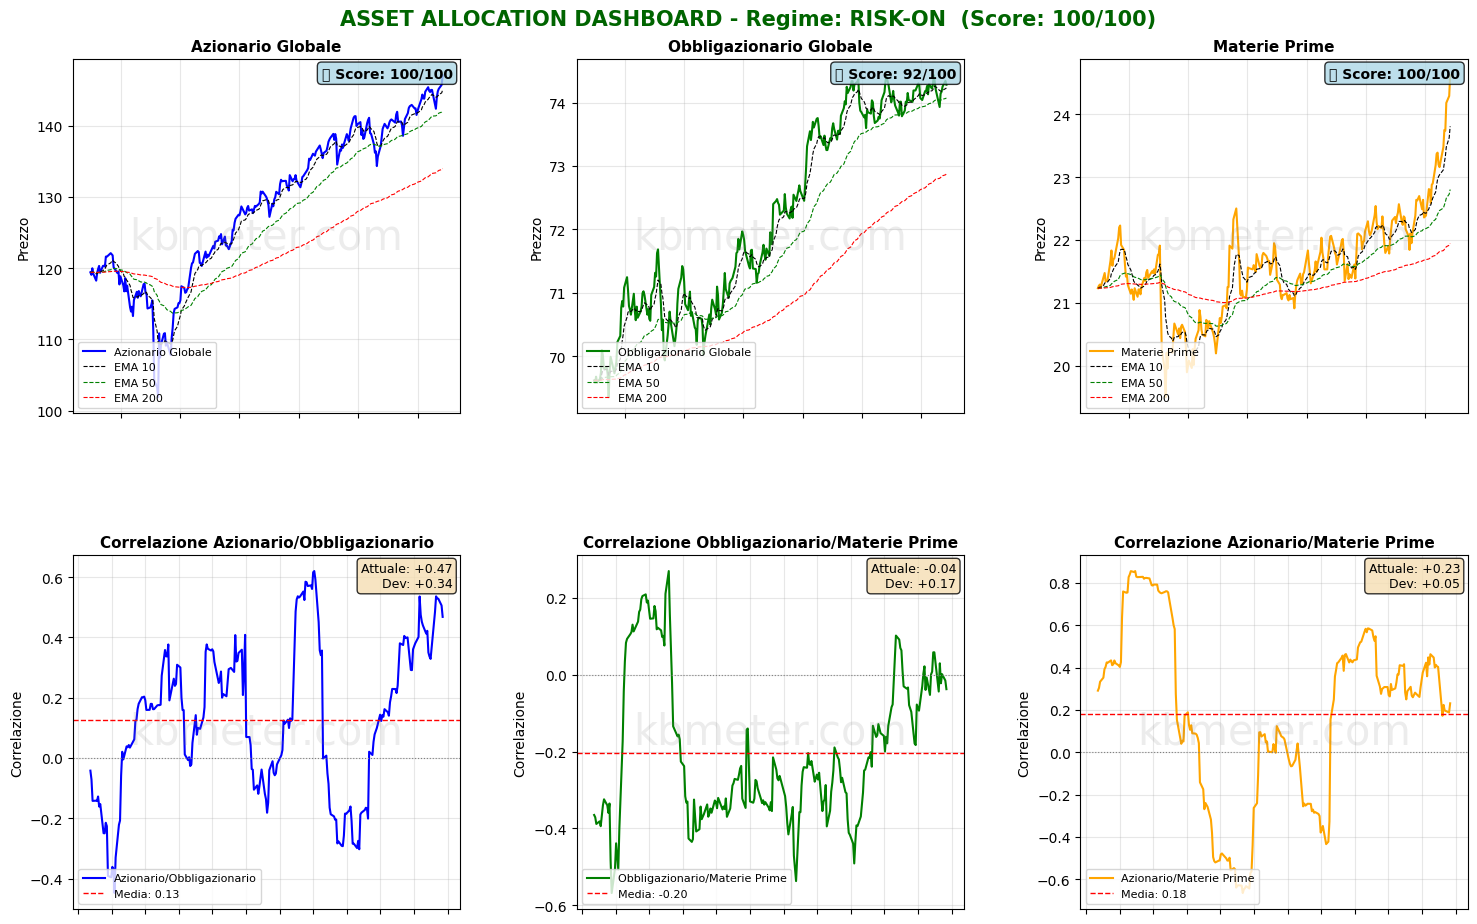
ASSET ALLOCATION & REGIME ANALYSIS - 2026-01-28
======================================================================

MARKET REGIME: RISK-ON
REGIME SCORE: 100.0/100

======================================================================
TREND AND VOLATILITY ANALYSIS
======================================================================

GLOBAL EQUITIES (ACWI):
  Short-Term Trend (5d): +2.12% | ABOVE EMA 10
  Medium-Term Trend (20d): +3.27% | ABOVE EMA 50
  Long-Term Trend (60d): +5.09% | ABOVE EMA 200

  Volatility 5d: 6.0%
  Volatility 20d: 10.6%
  Volatility 60d: 11.4%

COMMODITIES (DBC):
  Medium-Term Trend (20d): +9.47% | ABOVE EMA 50
  Volatility 20d: 15.1%

ACWI/BND Correlation (30d): 0.468

REGIME INTERPRETATION:
The market is in a risk-on regime. Equities show positive trends across multiple
time horizons and volatility remains contained. Investors favor risk assets.
Suggested positioning: OVERWEIGHT equities.

======================================================================
ASSET RANKING - WHO IS PERFORMING BEST?
======================================================================

🥇 1. Global Equities (ACWI) - SCORE: 100/100
     Price: $147.06
     Trend: ABOVE EMA10 | ABOVE EMA50 | ABOVE EMA200
     Performance: 5d +2.12% | 20d +3.27% | 60d +5.09%
     Volatility: 5d 6.0% | 20d 10.6% | 60d 11.4%
     Drawdown: 0.00%
     → Asset in STRONG HEALTH: positive trends and controlled volatility

🥈 2. Commodities (DBC) - SCORE: 100/100
     Price: $24.62
     Trend: ABOVE EMA10 | ABOVE EMA50 | ABOVE EMA200
     Performance: 5d +3.66% | 20d +9.47% | 60d +12.01%
     Volatility: 5d 11.9% | 20d 15.1% | 60d 13.0%
     Drawdown: 0.00%
     → Asset in STRONG HEALTH: positive trends and controlled volatility

🥉 3. Global Bonds (BND) - SCORE: 92/100
     Price: $74.28
     Trend: ABOVE EMA10 | ABOVE EMA50 | ABOVE EMA200
     Performance: 5d +0.19% | 20d -0.03% | 60d +0.55%
     Volatility: 5d 2.1% | 20d 2.8% | 60d 2.8%
     Drawdown: -0.20%
     → Asset in STRONG HEALTH: positive trends and controlled volatility

======================================================================
CORRELATION ANALYSIS - CURRENT vs HISTORICAL
======================================================================

ACWI/BND:
  Current correlation (30d): +0.468
  Historical average (1 year): +0.127
  Deviation: +0.341
  ⚠️ SIGNIFICANT DEVIATION from historical average
  → Positive correlation: diversification COMPROMISED

BND/DBC:
  Current correlation (30d): -0.037
  Historical average (1 year): -0.202
  Deviation: +0.165

ACWI/DBC:
  Current correlation (30d): +0.231
  Historical average (1 year): +0.182
  Deviation: +0.049

======================================================================
OPERATIONAL SUMMARY
======================================================================

STRONGEST ASSET: Global Equities (Score: 100/100)
WEAKEST ASSET: Global Bonds (Score: 92/100)

SUGGESTED ACTION: Favor the strongest asset, maintain exposure to risk.
DIVERSIFICATION: EXCELLENT - Asset classes are moving independently.

======================================================================
Analysis automatically generated by kbmeter.com
Date: 2026-01-28
On the macro front, attention is firmly on the Fed meeting. Markets expect interest rates to be left unchanged, but are hoping for clearer signals on future policy moves and possible comments on the sensitive issue of dollar weakness. Also due today is the Bank of Canada’s rate decision, alongside a series of relevant data releases including Australian inflation at the end of 2025, German consumer confidence for January and India’s industrial production.
On the earnings front, the week moves into full swing with results from Microsoft, Meta and Tesla, set to provide fresh direction for the tech sector and broader market sentiment.
Already a subscriber? Login here
NOTES AND WARNINGS
Data compiled by kbmeter.com. Analysis date: 28 January 2026 - 7:46 AM GMT+1
This content is provided for informational purposes only and should not be considered financial advice. All scores and assessments are based on the previous trading day’s closing prices. Futures indications refer to the date and time of the analysis.
