
Markets Face Critical Test as Middle East Tensions, U.S. PCE Inflation and Key Intermarket Levels Converge
Thursday is shaping up to be a pivotal day for financial markets. While sentiment remains broadly risk-on, the conflicting news flow from the Middle East and the release of the U.S. PCE inflation data could alter investors’ stance. Many of the intermarket indicators on our dashboards are currently sitting at key resistance/support levels, while global bond and commodity asset classes are testing their 50-day moving averages. These are all signs that a significant move — whose direction remains difficult to decipher — could be approaching.
Market Weather Map
May 28, 2026
US Equities
Eu Equities
Asia Equities
Commodities
Bonds
Dollar Index
Technology
Gold
Oil
Crypto
Market Summary
Do you want to see the score details for all assets monitored by KBMeter?
Try free for 14 days →Financial markets sentiment
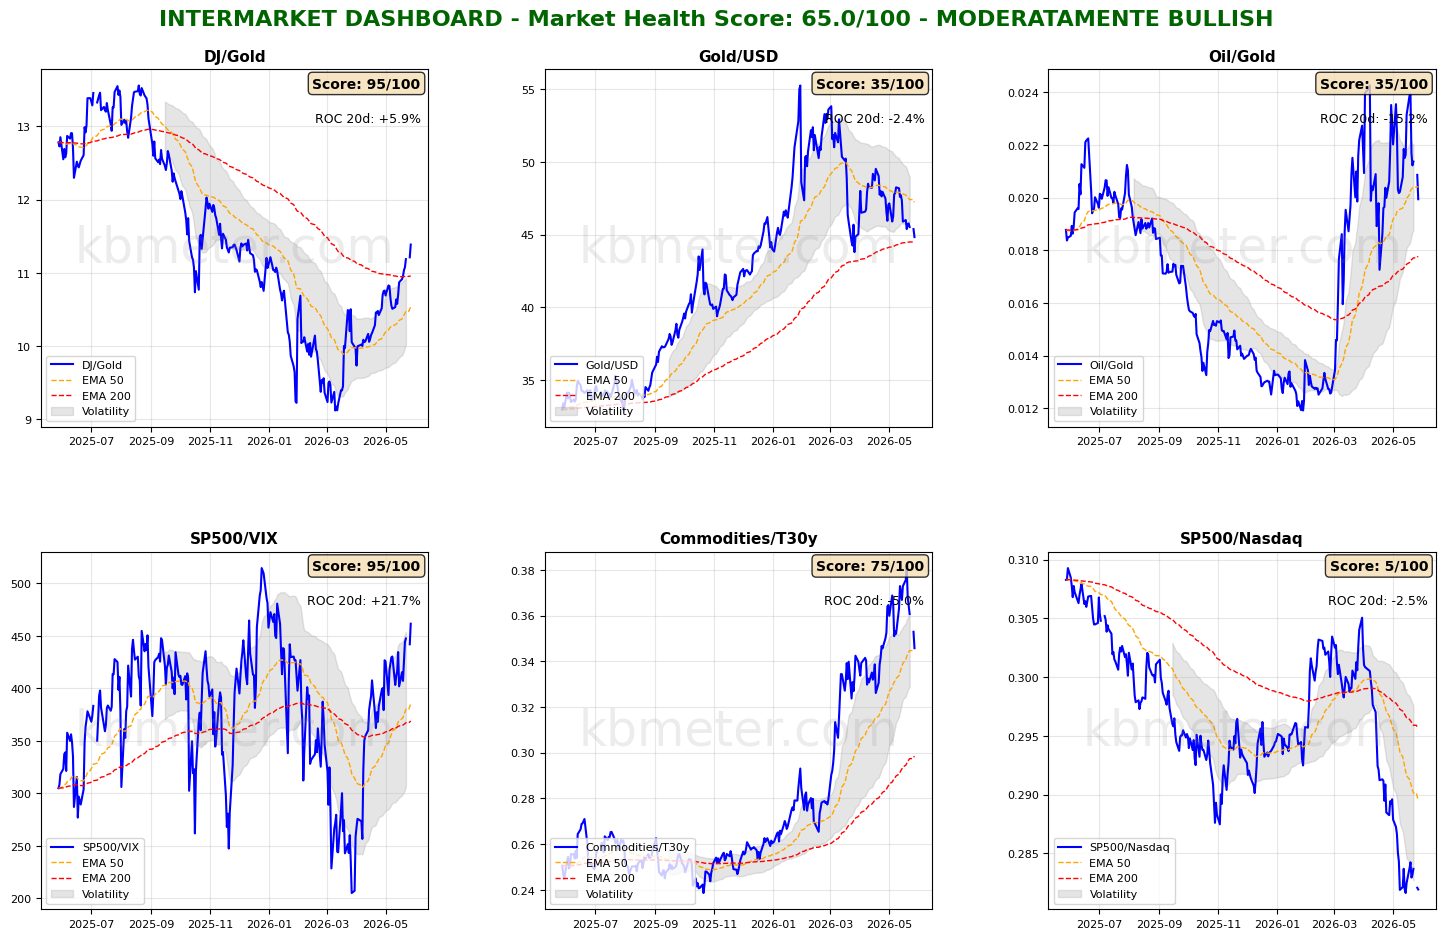
Futures are reacting to the latest developments from the Gulf, pointing to a negative opening for both European and U.S. markets. Financial markets are currently showing a neutral sentiment. Intermarket analysis highlights a Market Health Score of 65/100 (moderately positive). Our intermarket dashboards continue to signal an environment still tilted toward risk-on, although many indicators have entered important resistance/support zones. This could mark the beginning of a more dynamic phase, and the macro backdrop (geopolitics and PCE inflation) appears to support such a scenario.
The Gold/Dollar ratio is now testing support at its long-term moving average, while the Oil/Gold and Commodities/Bonds ratios are “dancing” around support at their medium-term moving averages. Meanwhile, the bullish crossover between medium- and long-term moving averages in the S&P 500/VIX ratio is consolidating, and the Dow/Gold ratio continues to rise.
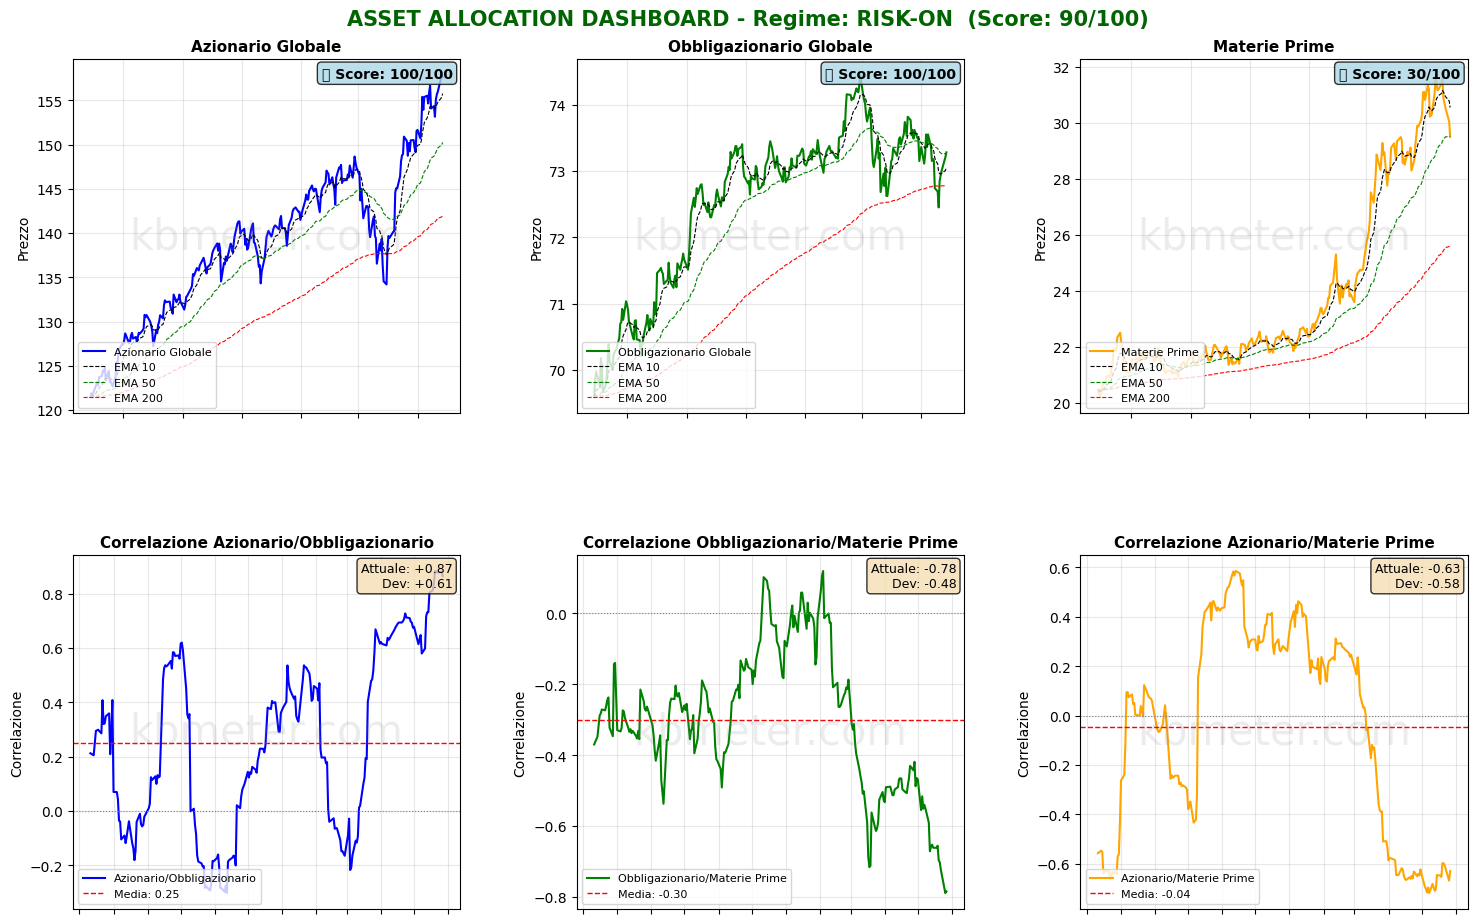
Asset classes continue to point to a short-term bullish trend for equities, while bonds remain stuck at resistance around the medium-term moving average, searching for enough strength — in other words, positive news — to break higher. Commodities are also sitting on support at the 50-day moving average, “victims” of the wide fluctuations in oil prices.
Our market weather map continues to indicate solid health for equities — with the tech sector standing out — as well as for the U.S. dollar. Cryptocurrencies, however, continue to struggle.
Global Futures – Pre-Market Sentiment
Pre-Market Futures: Global futures are signaling a risk-off sentiment (-0.77% on average), with U.S. futures negative (-0.56%), Europe negative (-0.61%), and Asia sharply negative (-1.53%).
📊 Global Futures – Pre-Market Sentiment
- IBEX 35 derived: +0.45%
- TecDAX derived: +0.15%
- Mini MDAX derived: +0.00%
- Hang Seng derived: -2.17%
- Nikkei 225 derived: -1.89%
- Euro Stoxx 50 derived: -1.30%
Intermarket details
📄 Detailed Intermarket Analysis
INTERMARKET ANALYSIS - 2026-05-28
============================================================

MARKET HEALTH SCORE: 65.0/100
SENTIMENT: MODERATELY BULLISH

============================================================
SUMMARY OF KEY RATIOS
============================================================


DJ/Gold:
  - Component score: 95.0/100
  - Current value: 11.3871
  - Position vs EMA50: ABOVE
  - 20-day ROC: +5.92%
  - 50-day ROC: +21.18%
  → Preference for risk assets vs safe havens

Gold/USD:
  - Component score: 35.0/100
  - Current value: 44.8292
  - Position vs EMA50: BELOW
  - 20-day ROC: -2.44%
  - 50-day ROC: -10.74%

Oil/Gold:
  - Component score: 35.0/100
  - Current value: 0.0199
  - Position vs EMA50: BELOW
  - 20-day ROC: -15.21%
  - 50-day ROC: +3.64%
  → Weakening energy demand

SP500/VIX:
  - Component score: 95.0/100
  - Current value: 461.6550
  - Position vs EMA50: ABOVE
  - 20-day ROC: +21.69%
  - 50-day ROC: +53.77%
  → Expanding risk appetite

Commodities/T30y:
  - Component score: 75.0/100
  - Current value: 0.3457
  - Position vs EMA50: ABOVE
  - 20-day ROC: -5.02%
  - 50-day ROC: +4.32%
  → Economic growth expectations

SP500/Nasdaq:
  - Component score: 5.0/100
  - Current value: 0.2819
  - Position vs EMA50: BELOW
  - 20-day ROC: -2.52%
  - 50-day ROC: -5.64%

============================================================
CONCLUSIONS AND RECOMMENDATIONS
============================================================

The market remains moderately constructive. Some ratios are showing positive signals,
but cautionary elements persist. Monitor developments closely.
Positioning: SELECTIVE, favor quality.


STRONGEST RATIOS:
  • DJ/Gold: 95.0/100
  • SP500/VIX: 95.0/100
  • Commodities/T30y: 75.0/100

WEAKEST RATIOS:
  • Gold/USD: 35.0/100
  • Oil/Gold: 35.0/100
  • SP500/Nasdaq: 5.0/100

============================================================
Data processed by kbmeter.com
Date: 2026-05-28
📄 Detailed Asset Allocation Analysis
ASSET ALLOCATION & REGIME ANALYSIS - 2026-05-28
======================================================================

MARKET REGIME: RISK-ON
REGIME SCORE: 90.0/100

======================================================================
TREND AND VOLATILITY ANALYSIS
======================================================================

GLOBAL EQUITIES (ACWI):
  Short-Term Trend (5d): +1.64% | ABOVE EMA 10
  Medium-Term Trend (20d): +5.70% | ABOVE EMA 50
  Long-Term Trend (60d): +9.72% | ABOVE EMA 200

  5d Volatility: 9.8%
  20d Volatility: 14.8%
  60d Volatility: 18.1%

COMMODITIES (DBC):
  Medium-Term Trend (20d): -5.12% | BELOW EMA 50
  20d Volatility: 24.3%

ACWI/BND Correlation (30d): 0.865

REGIME INTERPRETATION:
The market is currently in a risk-on regime. Equities are showing positive trends across multiple
time horizons, while volatility remains contained. Investors continue to favor risk assets.
Suggested positioning: OVERWEIGHT equities.

======================================================================
ASSET RANKING - WHO IS PERFORMING BEST?
======================================================================

🥇 1. Global Equities (ACWI) - SCORE: 100/100
     Price: $157.64
     Trend: ABOVE EMA10 | ABOVE EMA50 | ABOVE EMA200
     Performance: 5d +1.64% | 20d +5.70% | 60d +9.72%
     Volatility: 5d 9.8% | 20d 14.8% | 60d 18.1%
     Drawdown: -0.13%
     → Asset in STRONG HEALTH: positive trends and controlled volatility

🥈 2. Global Bonds (BND) - SCORE: 100/100
     Price: $73.28
     Trend: ABOVE EMA10 | ABOVE EMA50 | ABOVE EMA200
     Performance: 5d +0.59% | 20d +0.18% | 60d -1.06%
     Volatility: 5d 3.2% | 20d 4.8% | 60d 4.6%
     Drawdown: -1.56%
     → Asset in STRONG HEALTH: positive trends and controlled volatility

🥉 3. Commodities (DBC) - SCORE: 30/100
     Price: $29.49
     Trend: BELOW EMA10 | BELOW EMA50 | ABOVE EMA200
     Performance: 5d -4.50% | 20d -5.12% | 60d +13.82%
     Volatility: 5d 12.5% | 20d 24.3% | 60d 25.1%
     Drawdown: -6.94%
     → Asset in WEAK conditions: negative trends or elevated volatility

======================================================================
CORRELATION ANALYSIS - CURRENT vs HISTORICAL
======================================================================

ACWI/BND:
  Current Correlation (30d): +0.865
  Historical Average (1 year): +0.252
  Deviation: +0.613
  ⚠️ SIGNIFICANT DEVIATION from historical average
  → Positive correlation: diversification COMPROMISED

BND/DBC:
  Current Correlation (30d): -0.785
  Historical Average (1 year): -0.300
  Deviation: -0.484
  ⚠️ SIGNIFICANT DEVIATION from historical average

ACWI/DBC:
  Current Correlation (30d): -0.629
  Historical Average (1 year): -0.045
  Deviation: -0.584
  ⚠️ SIGNIFICANT DEVIATION from historical average
  → Negative correlation: possible supply-driven shift

======================================================================
OPERATIONAL SUMMARY
======================================================================

STRONGEST ASSET: Global Equities (Score: 100/100)
WEAKEST ASSET: Commodities (Score: 30/100)

SUGGESTED ACTION: Favor the strongest asset while maintaining risk exposure.
DIVERSIFICATION: WEAK - Asset classes tend to move together.

======================================================================
Data processed by kbmeter.com
Date: 2026-05-28
Macroeconomic calendar
Today’s macroeconomic calendar offers several noteworthy catalysts. The session begins with data on private sector confidence in the Eurozone for May 2026. Later, the United States will release the updated estimate for Q1 2026 GDP growth, data on personal income and spending for April 2026, durable goods orders for April 2026, and the highly anticipated new reading of PCE inflation, the inflation gauge most closely monitored by the Federal Reserve.
Already a subscriber? Login here
NOTES AND WARNINGS
Data compiled by kbmeter.com. Analysis date: 28 May 2026 - 7:50 AM GMT+1
This content is provided for informational purposes only and should not be considered financial advice. All scores and assessments are based on the previous trading day’s closing prices. Futures indications refer to the date and time of the analysis.
