Markets Eye US-Iran Talks, March CPI; Volatility Stays High as Risk-On Returns
End of the week with heightened tension in financial markets. Attention is building ahead of tomorrow’s anticipated meeting between the United States and Iran, while on the macro front—after February’s PCE inflation was absorbed without surprises—markets are now waiting to see the first effects on prices in the March 2026 US CPI inflation data.
Investors appear confident despite the many uncertainties: sentiment is turning positive, risk-on returns after weeks, but volatility remains very high. Futures point to a weak opening for both Europe and the United States.
Mappa Meteo dei Mercati
April 10, 2026
Azionario USA
Azionario Europa
Azionario Asia
Materie Prime
Obbligazioni
Indice Dollaro
Tecnologia
Oro
Petrolio
Criptovalute
Riepilogo Mercati
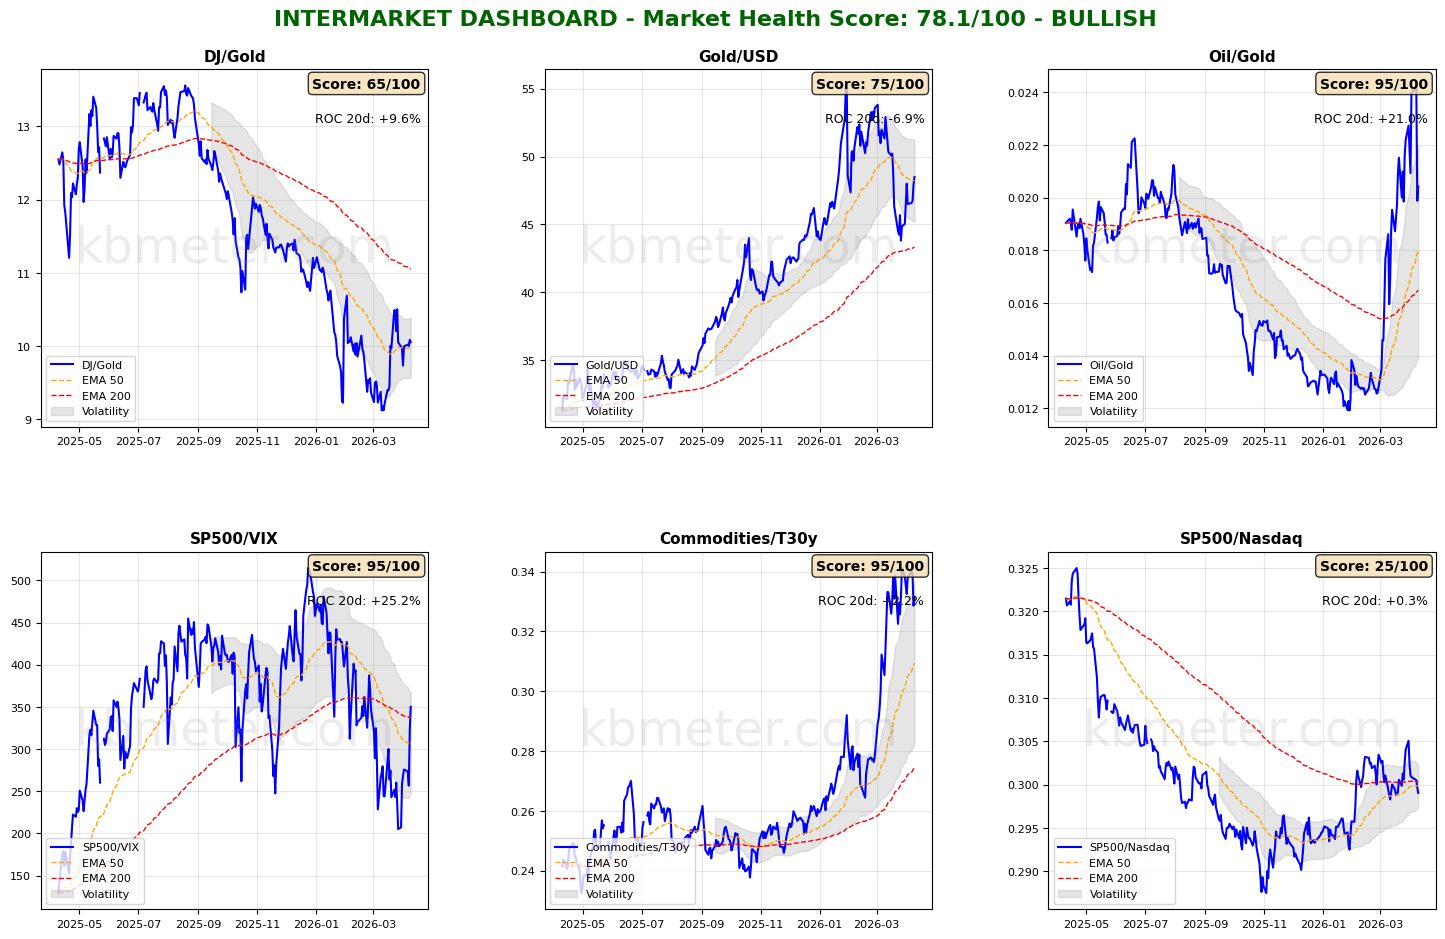
Financial markets currently show a neutral to moderately positive sentiment. Intermarket analysis highlights a Market Health Score of 78/100 (positive). Our intermarket dashboards are registering a clear improvement signal in risk appetite indicators, with our risk-on/risk-off barometer returning to positive territory after many weeks.
Is everything resolved? Not quite. Volatility remains elevated and sources of concern are still present: the crossover between moving averages in the Oil/Gold ratio, the commodities-to-long-term Treasuries ratio still near highs, and gold continuing to be supported.
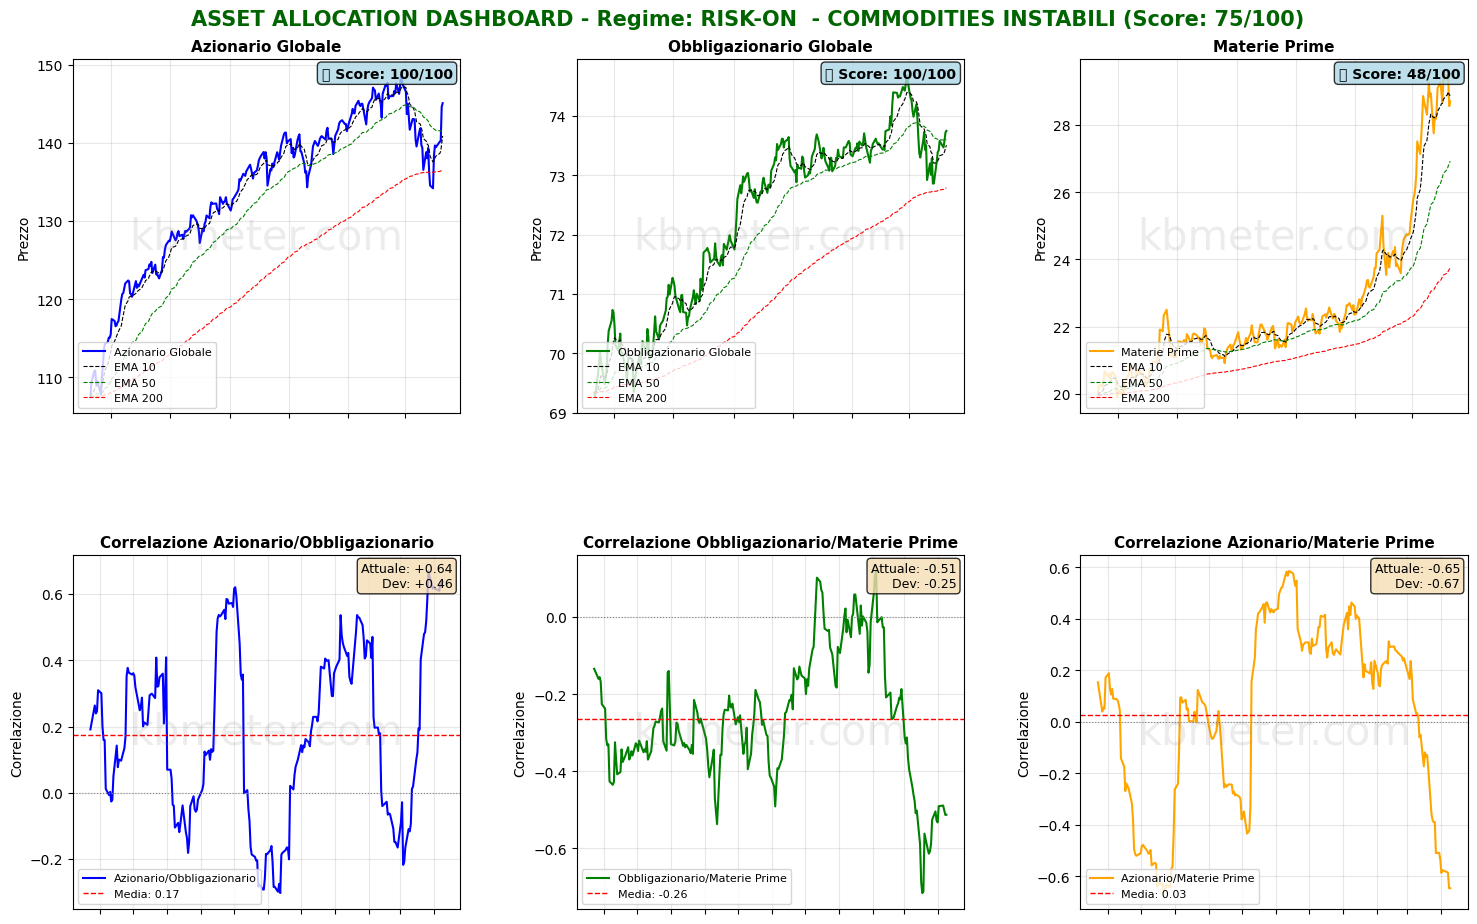
On the asset class front, it is worth noting the strong break above the 50-day moving average by both global equities and bonds—a significant recovery signal that still requires further confirmation. Volatility is increasing in commodities, which are rotating around the short-term moving average with a still upward, though more moderate, trend.
Pre-market futures: Global futures indicate a moderately risk-off sentiment (average -0.02%), with the US slightly negative (-0.03%), Europe slightly negative (-0.03%), and Asia slightly positive (+0.01%).
📊 Global Futures – Pre-Market Sentiment
- Euro Stoxx 50 derived: +0.67%
- Nikkei 225 derived: +0.66%
- Mini DAX: +0.65%
- TecDAX derived: -2.92%
- CSI 300: -0.64%
- Russell 2000: -0.17%
📄 Detailed Intermarket Analysis
INTERMARKET ANALYSIS - 2026-04-10
============================================================

MARKET HEALTH SCORE: 78.1/100
SENTIMENT: BULLISH

============================================================
SUMMARY OF KEY RATIOS
============================================================


DJ/Gold:
  - Component score: 65.0/100
  - Current value: 10.0550
  - Position vs EMA50: ABOVE
  - 20-day ROC: +9.58%
  - 50-day ROC: +4.23%
  → Preference for risk assets vs safe haven

Gold/USD:
  - Component score: 75.0/100
  - Current value: 48.4942
  - Position vs EMA50: ABOVE
  - 20-day ROC: -6.88%
  - 50-day ROC: -8.15%

Oil/Gold:
  - Component score: 95.0/100
  - Current value: 0.0204
  - Position vs EMA50: ABOVE
  - 20-day ROC: +20.95%
  - 50-day ROC: +66.29%
  → Rising energy demand

SP500/VIX:
  - Component score: 95.0/100
  - Current value: 350.1621
  - Position vs EMA50: ABOVE
  - 20-day ROC: +25.22%
  - 50-day ROC: -17.96%
  → Expanding risk appetite

Commodities/T30y:
  - Component score: 95.0/100
  - Current value: 0.3311
  - Position vs EMA50: ABOVE
  - 20-day ROC: +2.17%
  - 50-day ROC: +16.79%
  → Economic growth expectations

SP500/Nasdaq:
  - Component score: 25.0/100
  - Current value: 0.2990
  - Position vs EMA50: BELOW
  - 20-day ROC: +0.25%
  - 50-day ROC: +2.06%

============================================================
CONCLUSIONS AND RECOMMENDATIONS
============================================================

The market shows broad-based strength. Intermarket ratios suggest
a risk-friendly environment. High risk appetite and positive trends.
Positioning: CONSTRUCTIVE on risk assets.


STRONGEST RATIOS:
  • Oil/Gold: 95.0/100
  • SP500/VIX: 95.0/100
  • Commodities/T30y: 95.0/100

WEAKEST RATIOS:
  • Gold/USD: 75.0/100
  • DJ/Gold: 65.0/100
  • SP500/Nasdaq: 25.0/100

============================================================
Analysis automatically generated by kbmeter.com
Date: 2026-04-10
📄 Detailed Asset Allocation Analysis
ASSET ALLOCATION & REGIME ANALYSIS - 2026-04-10
======================================================================

MARKET REGIME: RISK-ON - UNSTABLE COMMODITIES
REGIME SCORE: 75.0/100

======================================================================
TREND AND VOLATILITY ANALYSIS
======================================================================

GLOBAL EQUITIES (ACWI):
  Short-Term Trend (5d): +4.04% | ABOVE EMA 10
  Medium-Term Trend (20d): +3.29% | ABOVE EMA 50
  Long-Term Trend (60d): +0.12% | ABOVE EMA 200

  5d Volatility: 21.5%
  20d Volatility: 23.9%
  60d Volatility: 17.5%

COMMODITIES (DBC):
  Medium-Term Trend (20d): -0.52% | ABOVE EMA 50
  20d Volatility: 27.9%

ACWI/BND Correlation (30d): 0.636

REGIME INTERPRETATION:
The market is in a risk-on regime. Equities show positive trends across multiple
time horizons and volatility remains contained. Investors favor risk assets.
Suggested positioning: OVERWEIGHT equities.

⚠️ COMMODITIES ALERT: Commodities are showing elevated volatility. This may
indicate uncertainty about economic growth or unstable supply/demand dynamics.

======================================================================
ASSET RANKING - WHO IS PERFORMING BEST?
======================================================================

🥇 1. Global Equities (ACWI) - SCORE: 100/100
     Price: $145.07
     Trend: ABOVE EMA10 | ABOVE EMA50 | ABOVE EMA200
     Performance: 5d +4.04% | 20d +3.29% | 60d +0.12%
     Volatility: 5d 21.5% | 20d 23.9% | 60d 17.5%
     Drawdown: -2.41%
     → Asset in STRONG HEALTH: positive trends and controlled volatility

🥈 2. Global Bonds (BND) - SCORE: 100/100
     Price: $73.75
     Trend: ABOVE EMA10 | ABOVE EMA50 | ABOVE EMA200
     Performance: 5d +0.23% | 20d +0.52% | 60d +0.26%
     Volatility: 5d 2.4% | 20d 5.5% | 60d 4.1%
     Drawdown: -1.26%
     → Asset in STRONG HEALTH: positive trends and controlled volatility

🥉 3. Commodities (DBC) - SCORE: 48/100
     Price: $28.71
     Trend: BELOW EMA10 | ABOVE EMA50 | ABOVE EMA200
     Performance: 5d -2.11% | 20d -0.52% | 60d +22.85%
     Volatility: 5d 29.1% | 20d 27.9% | 60d 25.6%
     Drawdown: -2.61%
     → Asset in NEUTRAL conditions: mixed signals

======================================================================
CORRELATION ANALYSIS - CURRENT vs HISTORICAL
======================================================================

ACWI/BND:
  Current correlation (30d): +0.636
  Historical average (1 year): +0.173
  Deviation: +0.463
  ⚠️ SIGNIFICANT DEVIATION from historical average
  → Positive correlation: diversification COMPROMISED

BND/DBC:
  Current correlation (30d): -0.513
  Historical average (1 year): -0.265
  Deviation: -0.248

ACWI/DBC:
  Current correlation (30d): -0.645
  Historical average (1 year): +0.027
  Deviation: -0.672
  ⚠️ SIGNIFICANT DEVIATION from historical average
  → Negative correlation: possible supply-driven shift

======================================================================
OPERATIONAL SUMMARY
======================================================================

STRONGEST ASSET: Global Equities (Score: 100/100)
WEAKEST ASSET: Commodities (Score: 48/100)

SUGGESTED ACTION: Favor the strongest asset, maintain risk exposure.
DIVERSIFICATION: GOOD - diversification benefits present.

======================================================================
Analysis automatically generated by kbmeter.com
Date: 2026-04-10
On the macro side, today’s agenda includes March inflation data from China and the United States. Also of interest are the final reading of Germany’s March consumer price index, the preliminary estimate of US consumer confidence for April, as well as employment data from Canada and US factory orders.
Already a subscriber? Login here
NOTES AND WARNINGS
Data compiled by kbmeter.com. Analysis date: 10 April 2026 - 7:48 AM GMT+1
This content is provided for informational purposes only and should not be considered financial advice. All scores and assessments are based on the previous trading day’s closing prices. Futures indications refer to the date and time of the analysis.