
Markets End the Week in Risk-On Mode, but Inflation and Tech Uncertainty Linger
The week in the financial markets closes with sentiment strengthening, although it remains “only” moderately positive. The latest U.S. macroeconomic data (inflation and PPI) have further reduced the likelihood of a Fed rate hike in September. This, combined with a return to calmer conditions—although we will see whether this is merely an apparent calm—in the technology sector, has pushed equities close to a score of 60, while bonds have returned to the 50-point score threshold. In this scenario, however, there is no shortage of potential pitfalls: Bessent’s latest comments on Iran, Trump’s remarks on tariffs and China, and the wait for Nvidia’s earnings figures. In the coming weeks, these very variables—geopolitics, inflation and technology—will determine the future of the summer rally in equities. Futures indicate a flat opening for both Europe and the United States.
A Brief Pause. Our daily market analysis will take a short break for a few weeks, until September 8, 2026. Our scores and market barometers will continue to be updated twice a week, while a weekly market analysis will be published every week. We would like to thank all our readers and wish you a restful and enjoyable break.
Market Weather Map
August 14, 2026
US Equities
Eu Equities
Asia Equities
Commodities
Bonds
Dollar Index
Technology
Gold
Oil
Crypto
Market Summary
Do you want to see the score details for all assets monitored by KBMeter?
Try free for 14 days →Financial markets sentiment
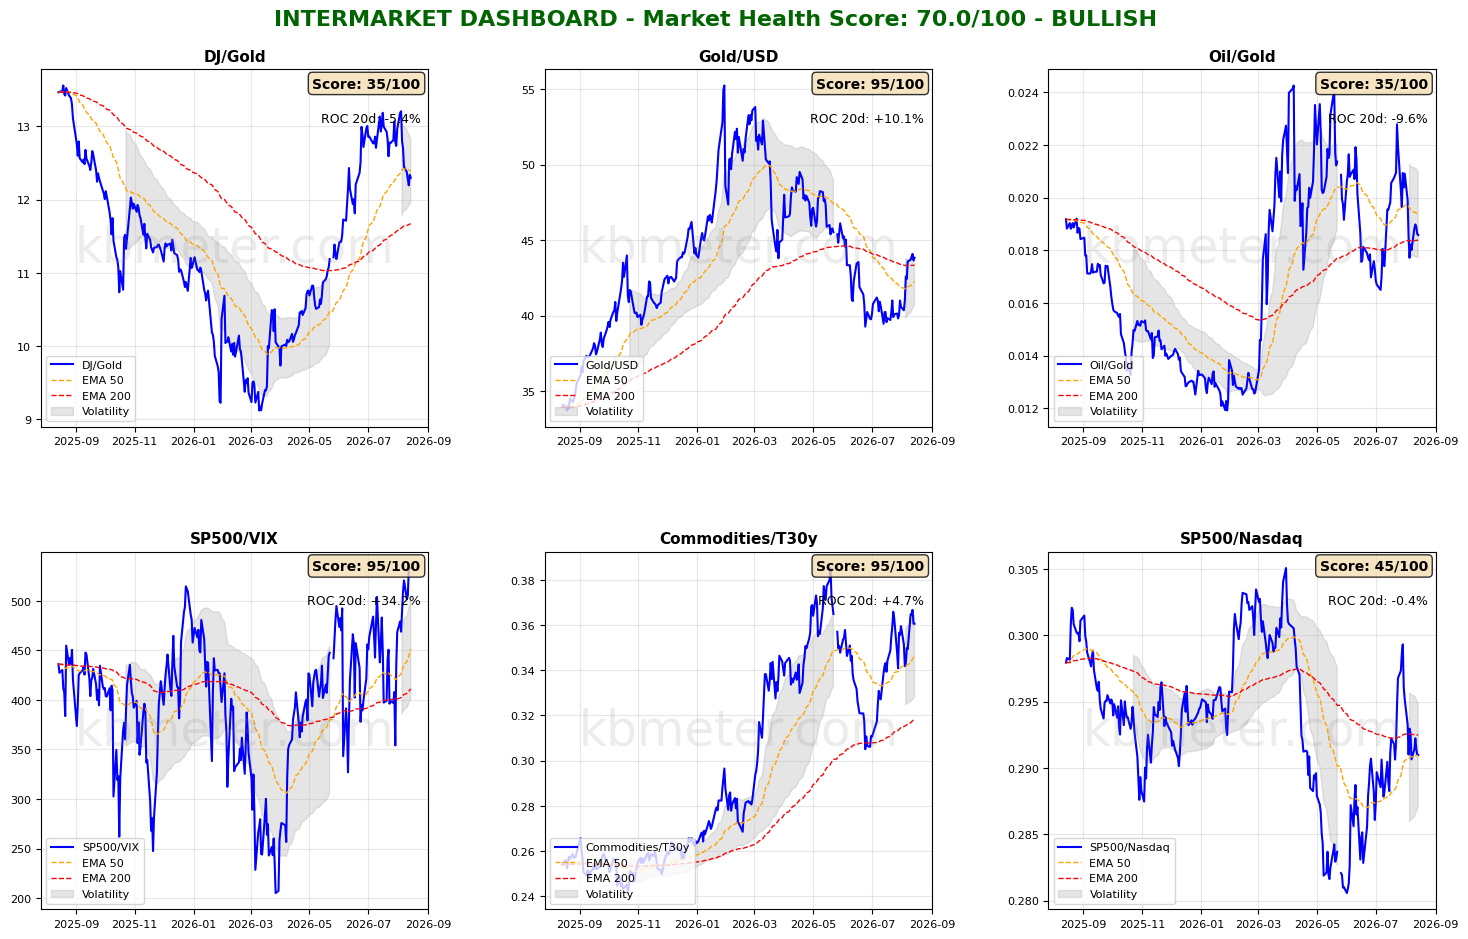
Financial markets are currently showing moderately positive sentiment. The intermarket analysis points to a Market Health Score of 70/100 (positive). Our intermarket dashboards close the week indicating a phase of moderate risk-on, although signs of uncertainty remain that could disrupt plans in the coming weeks. The S&P 500/VIX ratio is reaching its highest levels of the period, confirming investors’ risk-on bias. Gold is stabilizing after its gains in recent days: the Dollar/Gold and Oil/Gold ratios remain above their long-term moving averages, while the Dow/Gold ratio remains around its medium-term moving average. The Commodities/Bonds and S&P 500/Nasdaq ratios, on the other hand, confirm the areas of uncertainty mentioned above. Inflation risk remains on the table, while the technology sector continues to underperform the main Wall Street index. This is where the most significant headwinds capable of disrupting the summer equity rally could emerge—namely, from inflation and technology.
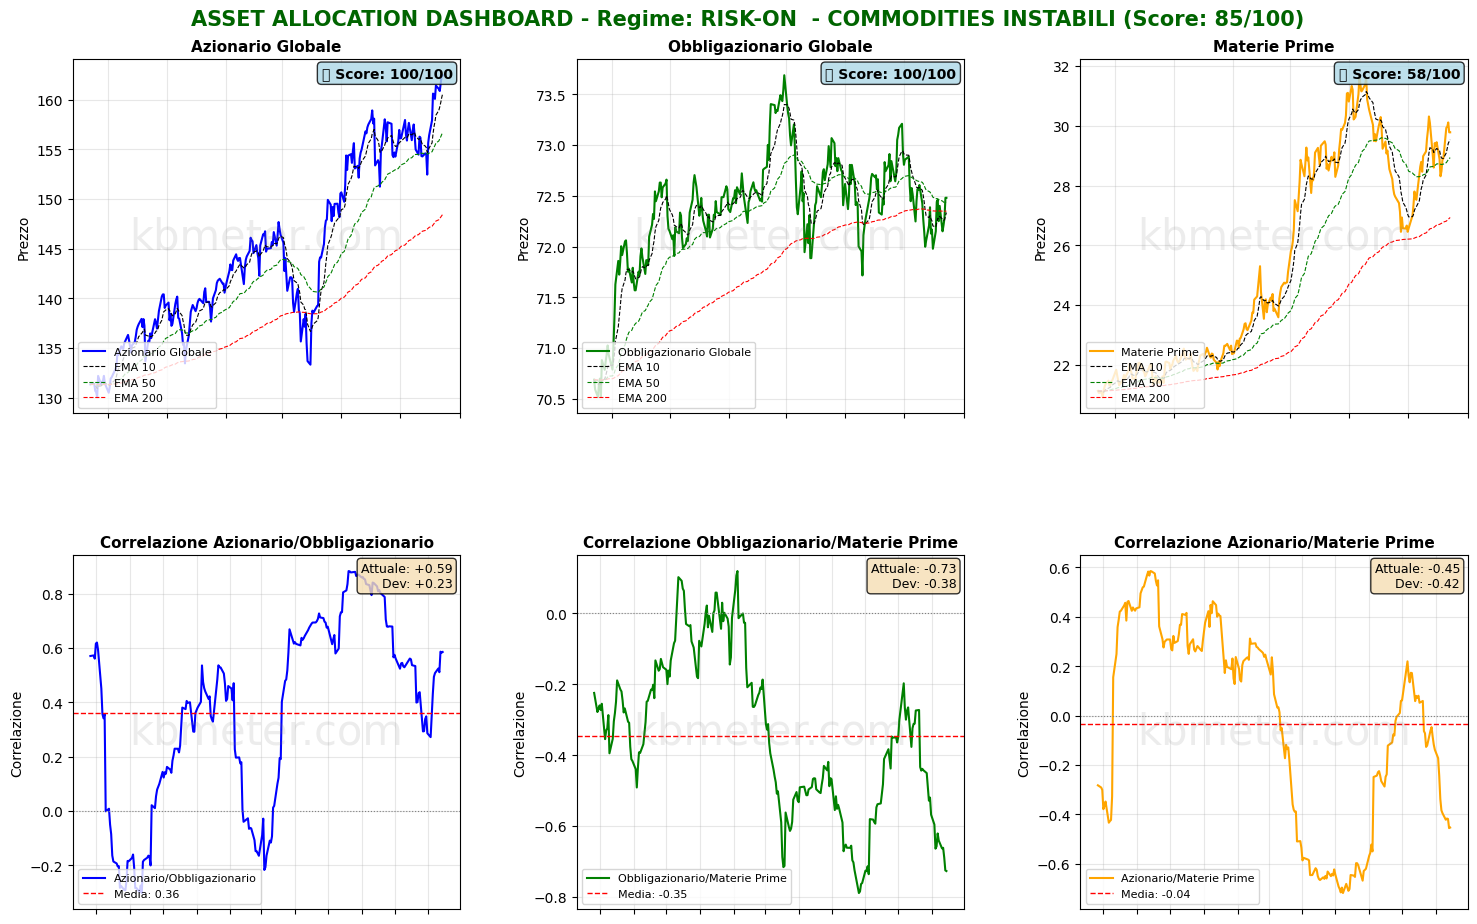
The asset-class assessment remains broadly stable: equities are trending higher in the short term, global bonds remain in the channel between their medium- and long-term moving averages, while commodities are showing short-term gains.
Our “weather map” confirms the picture described above: equities remain in the moderately positive zone (above 55 points), as does oil. Bonds and the Dollar remain in the neutral zone, while Gold is at the borderline between neutral and moderately positive. Cryptocurrencies remain the weakest-performing asset among those shown on the map.
As for score changes, the gains recorded by bond assets in the latest session are worth highlighting, as they reflect expectations of stable interest rates at least until the end of the summer. On a weekly basis, however, the standout move is the +15-point score gain in the energy sector.
Global Futures – Pre-Market Sentiment
Pre-Market Futures: Global futures point to moderately risk-off sentiment (-0.01% on average), with the U.S. slightly negative (-0.01%), Europe slightly positive (+0.12%), and Asia slightly negative (-0.41%).
📊 Global Futures – Pre-Market Sentiment
- DAX: +0.49%
- Nifty 50: +0.31%
- Euro Stoxx 50: +0.30%
- Nikkei 225: -0.82%
- Hang Seng: -0.28%
- CSI 300: -0.14%
Macroeconomic calendar
On the macroeconomic front, the week closes with the new estimate for Q2 2026 GDP growth in the euro area, U.S. retail sales for July 2026, and the preliminary reading of the University of Michigan Consumer Sentiment Index for August 2026.
Already a subscriber? Login here
NOTES AND WARNINGS
Data compiled by kbmeter.com. Analysis date: 14 August 2026 - 7:57 AM GMT+1
This content is provided for informational purposes only and should not be considered financial advice. All scores and assessments are based on the previous trading day’s closing prices. Futures indications refer to the date and time of the analysis.
