Market Sentiment Stays Neutral as Cyclicals Gain Ground at Tech’s Expense
The phase of sector rotation in equity markets continues, with technology stocks hit in the latest session by Alphabet’s cost outlook and softer prospects for the software sector. Financial markets are looking elsewhere: cyclical sectors are gaining traction, gold is regaining strength and oil prices are also moving higher. Sentiment remains between neutral and mildly negative. Futures this morning point to a weak start for both Europe and the United States.
Market Weather Map
February 5, 2026
US Equities
Eu Equities
Asia Equities
Commodities
Bonds
Dollar Index
Technology
Gold
Oil WTI
Crypto
Market Summary
How to interpret our financial indicators? Find out here.
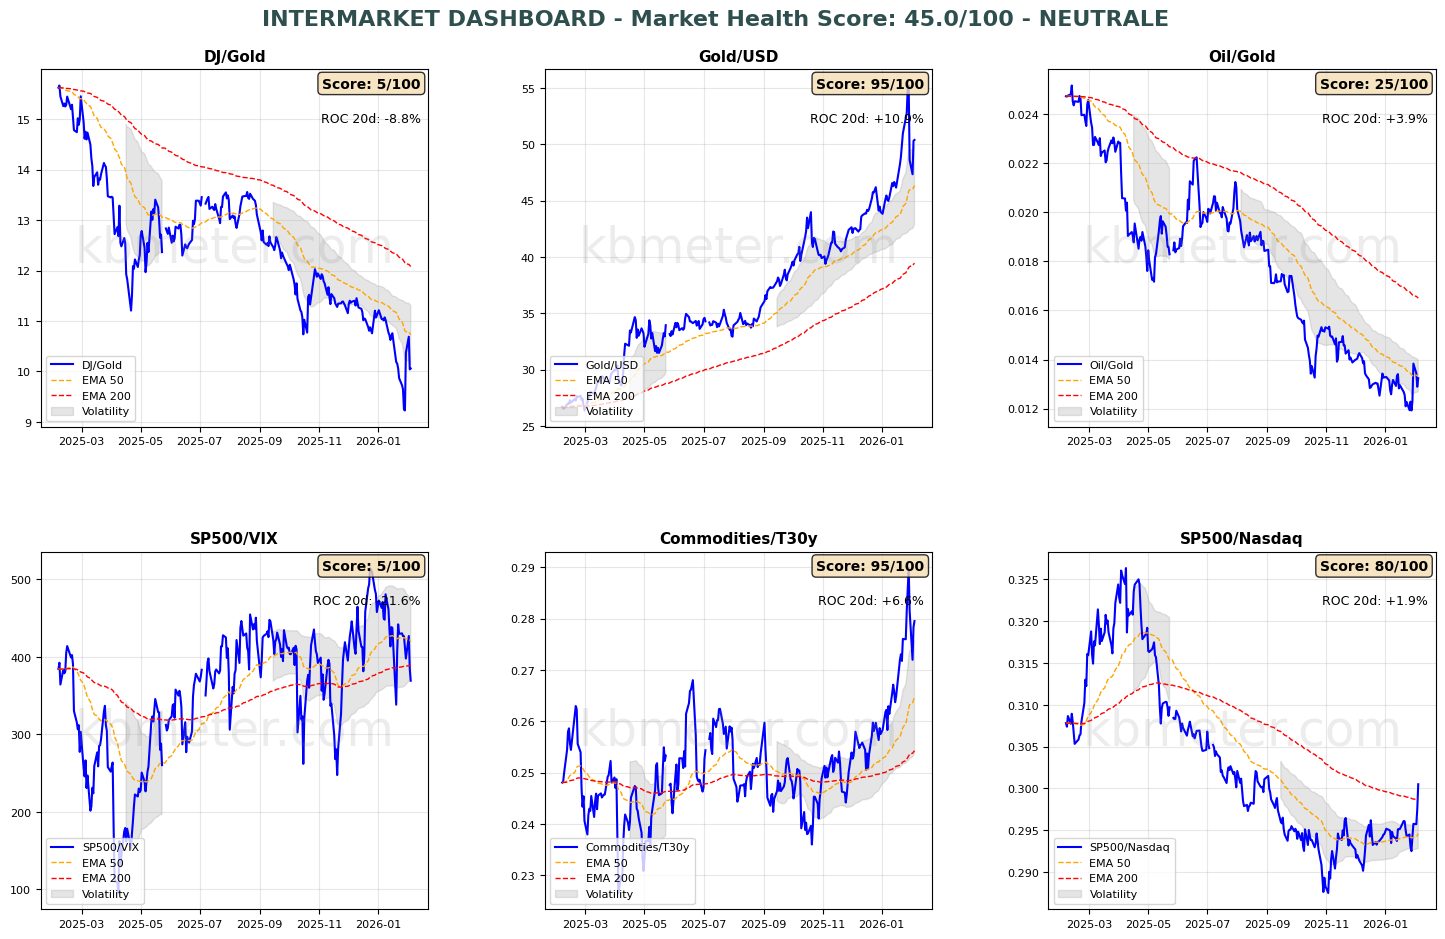
Overall, markets are showing a neutral to slightly negative tone. Intermarket analysis puts the Market Health Score at 45/100, consistent with a neutral backdrop. Our intermarket dashboards continue to highlight a cautious stance among investors. The sharp slowdown in the technology sector has pushed the S&P 500/Nasdaq ratio above its long-term moving average, an important technical signal pointing to a potential trend shift. The S&P 500/VIX strength ratio remains highly volatile, while both gold and oil are regaining momentum. Changes across asset classes remain limited, suggesting that the broader underlying market trend is, for now, intact.
Pre-market futures: Global futures signal a moderate risk-off bias (average -0.04%), with the U.S. slightly negative (-0.07%), Europe marginally lower (-0.03%) and Asia also modestly in the red (-0.03%).
📊 Global Futures – Pre-Market Sentiment
- CSI 300: +0.73%
- IBEX 35 derived: +0.55%
- FTSE MIB derived: +0.47%
- Nikkei 225 derived: -1.09%
- FTSE 100 derived: -0.33%
- Euro Stoxx 50 derived: -0.23%
📄 Detailed Intermarket Analysis
INTERMARKET ANALYSIS - 2026-02-05
============================================================

MARKET HEALTH SCORE: 45.0/100
SENTIMENT: NEUTRAL

============================================================
KEY RATIO SUMMARY
============================================================


DJ/Gold:
  - Component score: 5.0/100
  - Current value: 10.0604
  - Position vs EMA50: BELOW
  - 20-day ROC: -8.83%
  - 50-day ROC: -10.80%
  → Flight to safe havens

Gold/USD:
  - Component score: 95.0/100
  - Current value: 50.4036
  - Position vs EMA50: ABOVE
  - 20-day ROC: +10.86%
  - 50-day ROC: +24.45%

Oil/Gold:
  - Component score: 25.0/100
  - Current value: 0.0132
  - Position vs EMA50: BELOW
  - 20-day ROC: +3.87%
  - 50-day ROC: -9.19%
  → Rising energy demand

SP500/VIX:
  - Component score: 5.0/100
  - Current value: 369.2447
  - Position vs EMA50: BELOW
  - 20-day ROC: -21.58%
  - 50-day ROC: +49.19%
  → Contracting risk appetite

Commodities/T30y:
  - Component score: 95.0/100
  - Current value: 0.2795
  - Position vs EMA50: ABOVE
  - 20-day ROC: +6.60%
  - 50-day ROC: +12.40%
  → Economic growth expectations

SP500/Nasdaq:
  - Component score: 80.0/100
  - Current value: 0.3005
  - Position vs EMA50: ABOVE
  - 20-day ROC: +1.89%
  - 50-day ROC: +1.46%
  - ⚠️ ANOMALY DETECTED – Significant deviation from the average

============================================================
CONCLUSIONS AND RECOMMENDATIONS
============================================================

The market is in a neutral/sideways phase. Conflicting signals across ratios.
A clear directional bias is lacking. Await confirmation.
Positioning: BALANCED, avoid excesses.


STRONGEST RATIOS:
  • Gold/USD: 95.0/100
  • Commodities/T30y: 95.0/100
  • SP500/Nasdaq: 80.0/100

WEAKEST RATIOS:
  • Oil/Gold: 25.0/100
  • DJ/Gold: 5.0/100
  • SP500/VIX: 5.0/100

============================================================
Analysis automatically generated by kbmeter.com
Date: 2026-02-05
📄 Detailed Asset Allocation Analysis
ASSET ALLOCATION & REGIME ANALYSIS - 2026-02-05
======================================================================
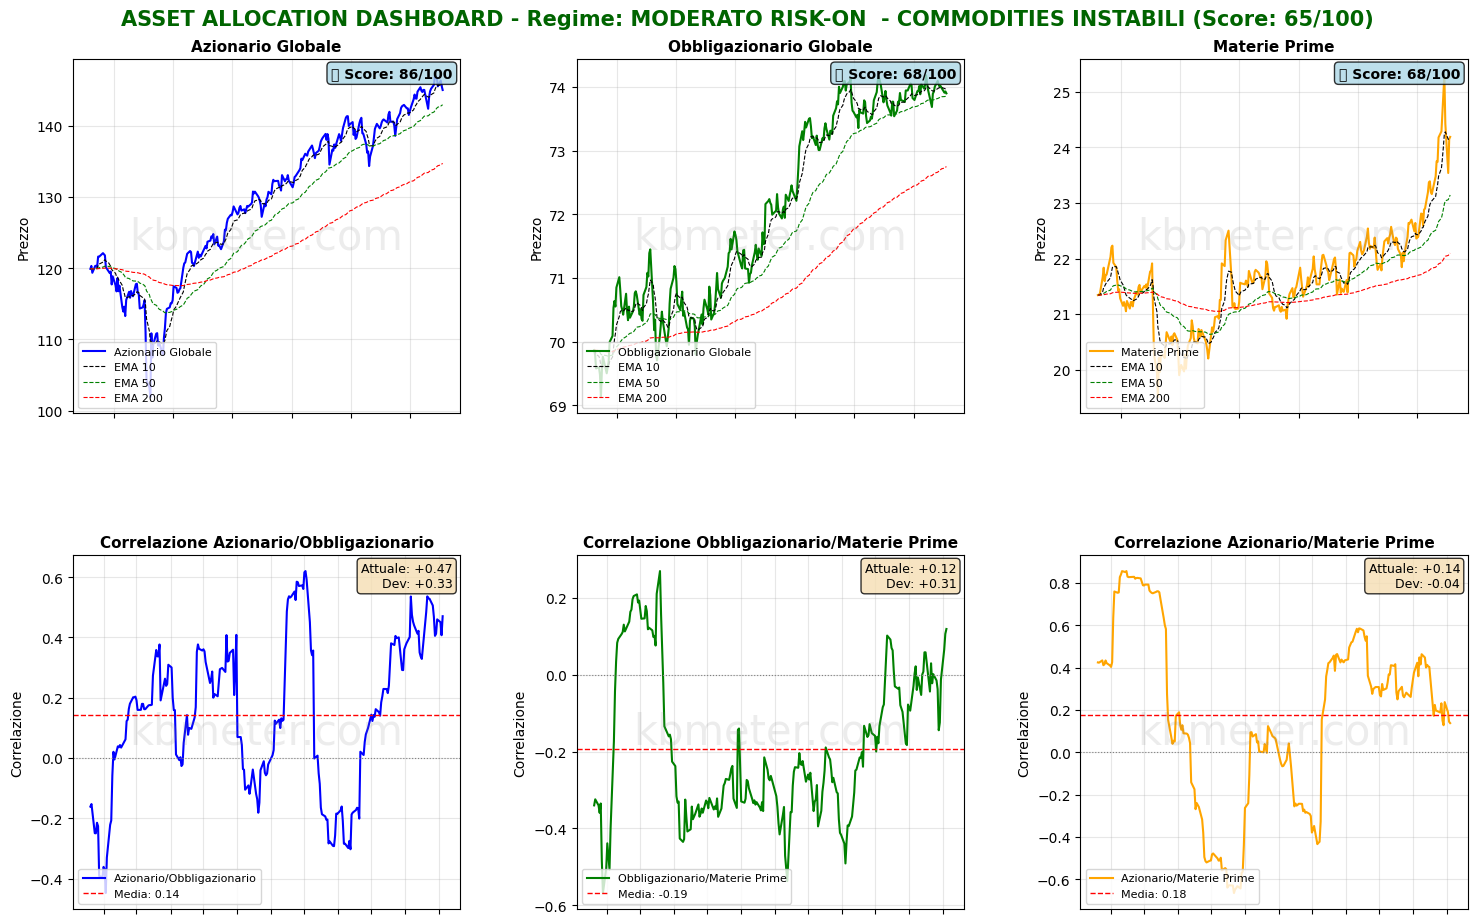
MARKET REGIME: MODERATE RISK-ON – UNSTABLE COMMODITIES
REGIME SCORE: 65.0/100
======================================================================
TREND AND VOLATILITY ANALYSIS
======================================================================
GLOBAL EQUITIES (ACWI):
Short-Term Trend (5d): -1.17% | BELOW EMA 10
Medium-Term Trend (20d): +0.82% | ABOVE EMA 50
Long-Term Trend (60d): +4.82% | ABOVE EMA 200
Volatility 5d: 8.3%
Volatility 20d: 10.6%
Volatility 60d: 11.0%
COMMODITIES (DBC):
Medium-Term Trend (20d): +7.08% | ABOVE EMA 50
Volatility 20d: 25.2%
ACWI/BND Correlation (30d): 0.470
REGIME INTERPRETATION:
The market shows risk appetite, albeit with some elements of caution.
The trend remains constructive, though mixed signals may emerge across
different time horizons.
Suggested positioning: BALANCED with a slight tilt toward risk assets.
⚠️ COMMODITIES ALERT: Commodities are showing elevated volatility. This may
signal uncertainty around economic growth or unstable supply/demand dynamics.
======================================================================
ASSET RANKING – WHO’S DOING BEST?
======================================================================
🥇 1. Global Equities (ACWI) – SCORE: 86/100
Price: $144.99
Trend: BELOW EMA10 | ABOVE EMA50 | ABOVE EMA200
Performance: 5d -1.17% | 20d +0.82% | 60d +4.82%
Volatility: 5d 8.3% | 20d 10.6% | 60d 11.0%
Drawdown: -1.41%
→ Asset in STRONG HEALTH: positive trends and controlled volatility
🥈 2. Global Bonds (BND) – SCORE: 68/100
Price: $73.90
Trend: BELOW EMA10 | ABOVE EMA50 | ABOVE EMA200
Performance: 5d -0.16% | 20d -0.16% | 60d +0.40%
Volatility: 5d 0.8% | 20d 2.5% | 60d 2.6%
Drawdown: -0.38%
→ Asset in FAIR CONDITIONS: predominantly positive signals
🥉 3. Commodities (DBC) – SCORE: 68/100
Price: $24.19
Trend: ABOVE EMA10 | ABOVE EMA50 | ABOVE EMA200
Performance: 5d -4.39% | 20d +7.08% | 60d +9.19%
Volatility: 5d 45.1% | 20d 25.2% | 60d 17.8%
Drawdown: -4.39%
→ Asset in FAIR CONDITIONS: predominantly positive signals
======================================================================
CORRELATION ANALYSIS – CURRENT vs HISTORICAL
======================================================================
ACWI/BND:
Current correlation (30d): +0.470
Historical average (1 year): +0.142
Deviation: +0.328
⚠️ SIGNIFICANT DEVIATION from historical average
→ Positive correlation: diversification COMPROMISED
BND/DBC:
Current correlation (30d): +0.120
Historical average (1 year): -0.192
Deviation: +0.311
⚠️ SIGNIFICANT DEVIATION from historical average
ACWI/DBC:
Current correlation (30d): +0.138
Historical average (1 year): +0.177
Deviation: -0.039
======================================================================
OPERATIONAL SUMMARY
======================================================================
STRONGEST ASSET: Global Equities (Score: 86/100)
WEAKEST ASSET: Commodities (Score: 68/100)
SUGGESTED ACTION: Favor the strongest asset while maintaining exposure to risk.
DIVERSIFICATION: EXCELLENT – Asset classes are moving independently.
======================================================================
Analysis automatically generated by kbmeter.com
Date: 2026-02-05
On the macro front, central banks return to center stage. Policy statements from the ECB and the Bank of England are due today, with expectations for both institutions to keep interest rates unchanged. Markets will be closely watching forward guidance, particularly in the euro area, where investors are assessing the likelihood of further policy support via additional rate cuts. Elsewhere, attention will be on euro-area retail sales for December 2025, U.S. initial jobless claims, and U.S. job openings data for December 2025.
On the earnings front, today’s focus is on results from Amazon, Shell and Unilever.
Already a subscriber? Login here
NOTES AND WARNINGS
Analysis automatically generated by kbmeter.com. Analysis date: 5 February 2026 - 7:45 AM GMT+1
This content is provided for informational purposes only and should not be considered financial advice. All scores and assessments are based on the previous trading day’s closing prices. Futures indications refer to the date and time of the analysis.