
Investor Concerns Hit Tech Stocks as Market Sentiment Deteriorates Ahead of US Jobs Data
Investor concerns are spilling over onto the weakest link in the chain. The US technology sector is bearing the brunt of the midterm election fallout, dragging Asian equities down with it. Against a backdrop of moderate risk-off sentiment, defensive sectors and European markets are attempting to hold their ground. Gold is recovering, albeit without much momentum, while oil continues to fluctuate amid uncertainty in the Middle East.
Against this turbulent backdrop, US labour market data for October 2026 could stir up further volatility (stronger employment growth potentially reinforcing a hawkish Fed stance) or help calm markets (stable employment figures). Futures point to a negative opening for both European and US markets.
Market Weather Map
November 6, 2026
US Equities
Eu Equities
Asia Equities
Commodities
Bonds
Dollar Index
Technology
Gold
Oil
Crypto
Market Summary
Do you want to see the score details for all assets monitored by KBMeter?
Try free for 14 days →Financial markets sentiment
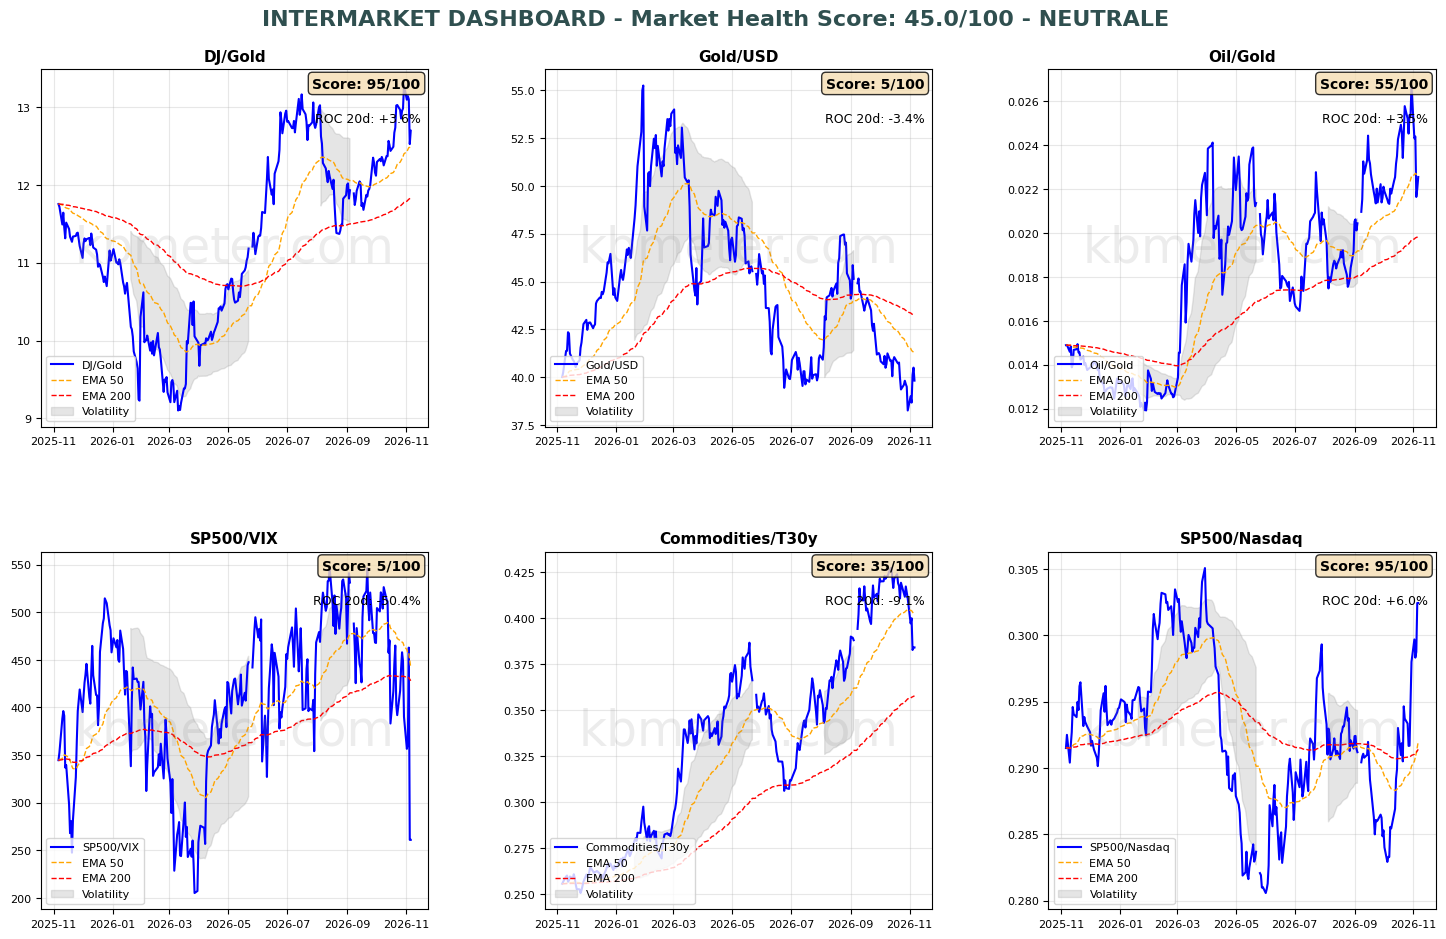
Financial markets are currently showing a neutral to moderately negative sentiment. Intermarket analysis points to a Market Health Score of 45/100. The sell-off in the technology sector is weighing on risk appetite across financial markets. The S&P 500/VIX ratio has plunged to its lowest level since last April, while the S&P 500/Nasdaq ratio has climbed to its highest level since last May. At the same time, however, gold’s recovery is failing to gain momentum, while the Commodities/Bonds ratio remains broadly stable. The Oil/Gold ratio has moved back towards its medium-term moving average, now testing it as resistance.
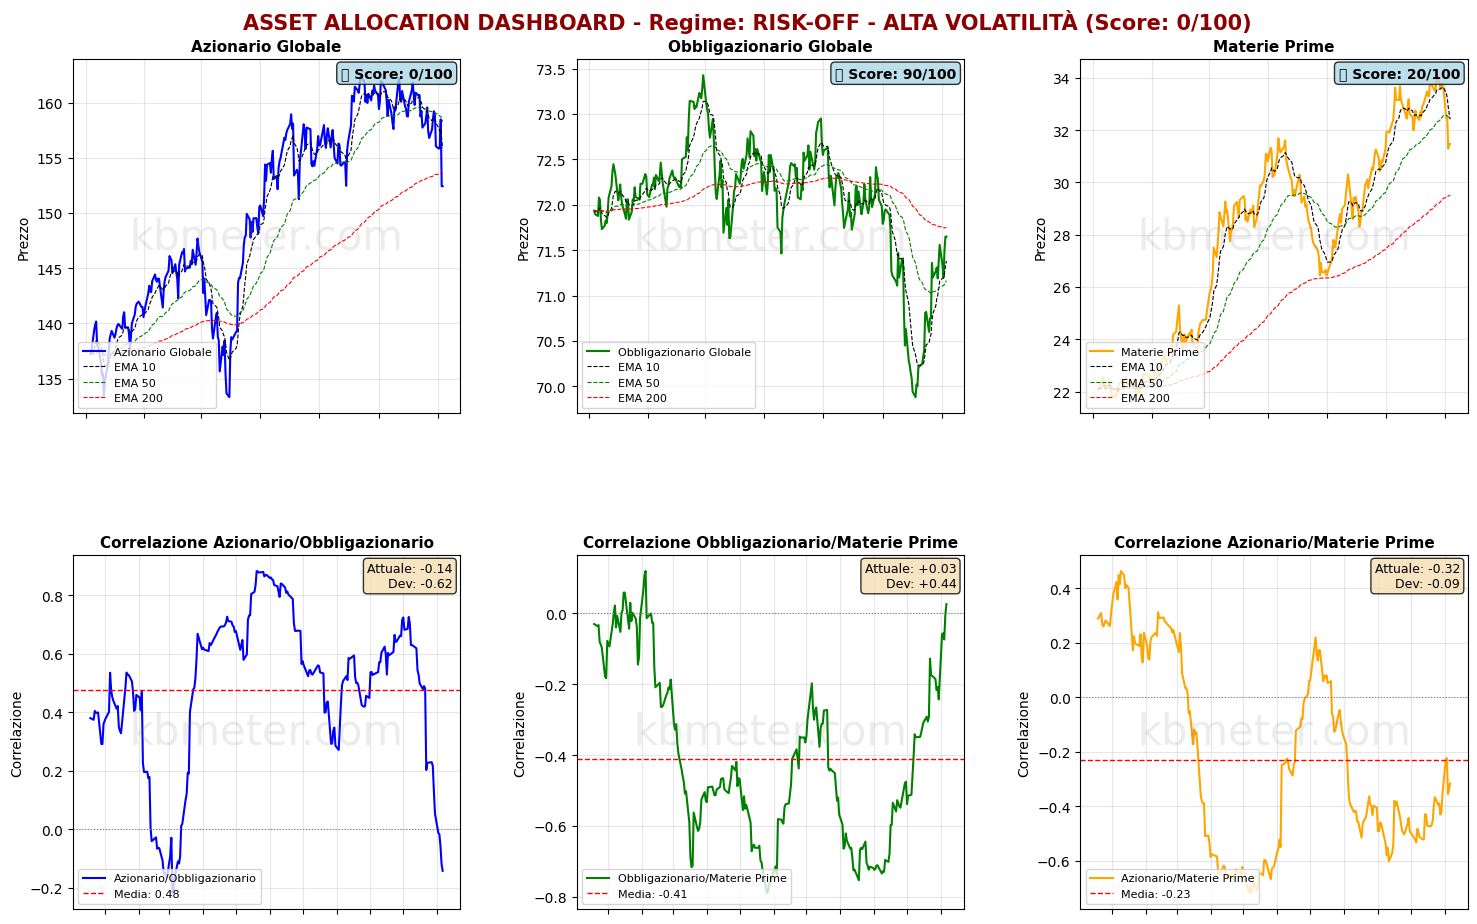
The most interesting developments are emerging across asset classes. Global equities have fallen below their long-term moving average, finding support in a medium-term support zone. It is still too early to draw conclusions: the shockwave sweeping across Asia and the technology sector makes the market picture less straightforward than it might initially appear. Global bonds have taken another step towards the resistance level represented by their long-term moving average, while their correlation with equities is approaching its annual lows and remains close to zero. Commodities continue to trade below their medium-term moving average.
Our market heatmap highlights the weakening of North American equities, which have slipped below the 50-point threshold, with the technology sector firmly in the weak zone. Bonds are consolidating in neutral territory, while the US dollar remains broadly stable and gold has climbed to just below the 50-point score threshold. Commodities are also showing weakness. Among the most significant daily changes, basic consumer goods, pharmaceuticals and financials stand out for their strong gains.
Global Futures – Pre-Market Sentiment
Pre-Market Futures: Global futures point to a risk-off sentiment (-0.58% on average), with the US slightly lower (-0.08%), Europe in negative territory (-0.73%) and Asia marginally higher (+0.25%).
📊 Global Futures – Pre-Market Sentiment
- US Tech 100: +0.81%
- Nikkei 225: +0.57%
- Nifty 50: +0.24%
- Taiwan: -5.01%
- FTSE MIB: -1.98%
- Euro Stoxx 50: -1.06%
Macroeconomic calendar
On the macroeconomic front, today’s agenda includes September 2026 industrial production data for Germany and Spain, September retail sales across the Eurozone, employment figures from Canada and the United States, and the University of Michigan’s preliminary Consumer Sentiment Index.
Assets to watch
Data as of Nov 5, 2026We have split the KBMeter scores into three bands, depending on their value: Weak, Intermediate or Strong. Here you can see which bands are most at risk of changing over the next 5 days and which ones hold.
The number on the right is the share of similar past cases in which the band had changed after 5 days. The higher it is, the more likely it is to change. The arrow in the current band appears when the asset is close to the border with the neighbouring band.
CONTINUE READING. ACTIVATE YOUR 14-DAY FREE TRIAL NOW. CLICK HERE
Already a subscriber? Login here
It does not say whether the price will rise or fall and it is not investment advice.
Already a subscriber? Login here
NOTES AND WARNINGS
Data compiled by kbmeter.com. Analysis date: 6 November 2026 - 8:57 AM GMT+1
This content is provided for informational purposes only and should not be considered financial advice. All scores and assessments are based on the previous trading day’s closing prices. Futures indications refer to the date and time of the analysis.