
Gold, Oil Lead Markets; Sentiment Moderately Positive as Commodity, Bond Volatility Rises
Gold and oil are the main protagonists at the start of the week across financial markets. While sentiment continues to lean towards risk-on (albeit within a neutral overall context), gold is continuing its recovery ahead of tomorrow’s US inflation data, while closely monitoring developments in the Middle East. Recent news from the region has provided fresh support to oil prices and the energy sector more broadly. This combination is generating a sharp increase in volatility across both commodities and global fixed income markets. Futures point to a flat opening for European markets and a slightly positive start for US markets.
Market Weather Map
August 11, 2026
US Equities
Eu Equities
Asia Equities
Commodities
Bonds
Dollar Index
Technology
Gold
Oil
Crypto
Market Summary
Do you want to see the score details for all assets monitored by KBMeter?
Try free for 14 days →Financial markets sentiment
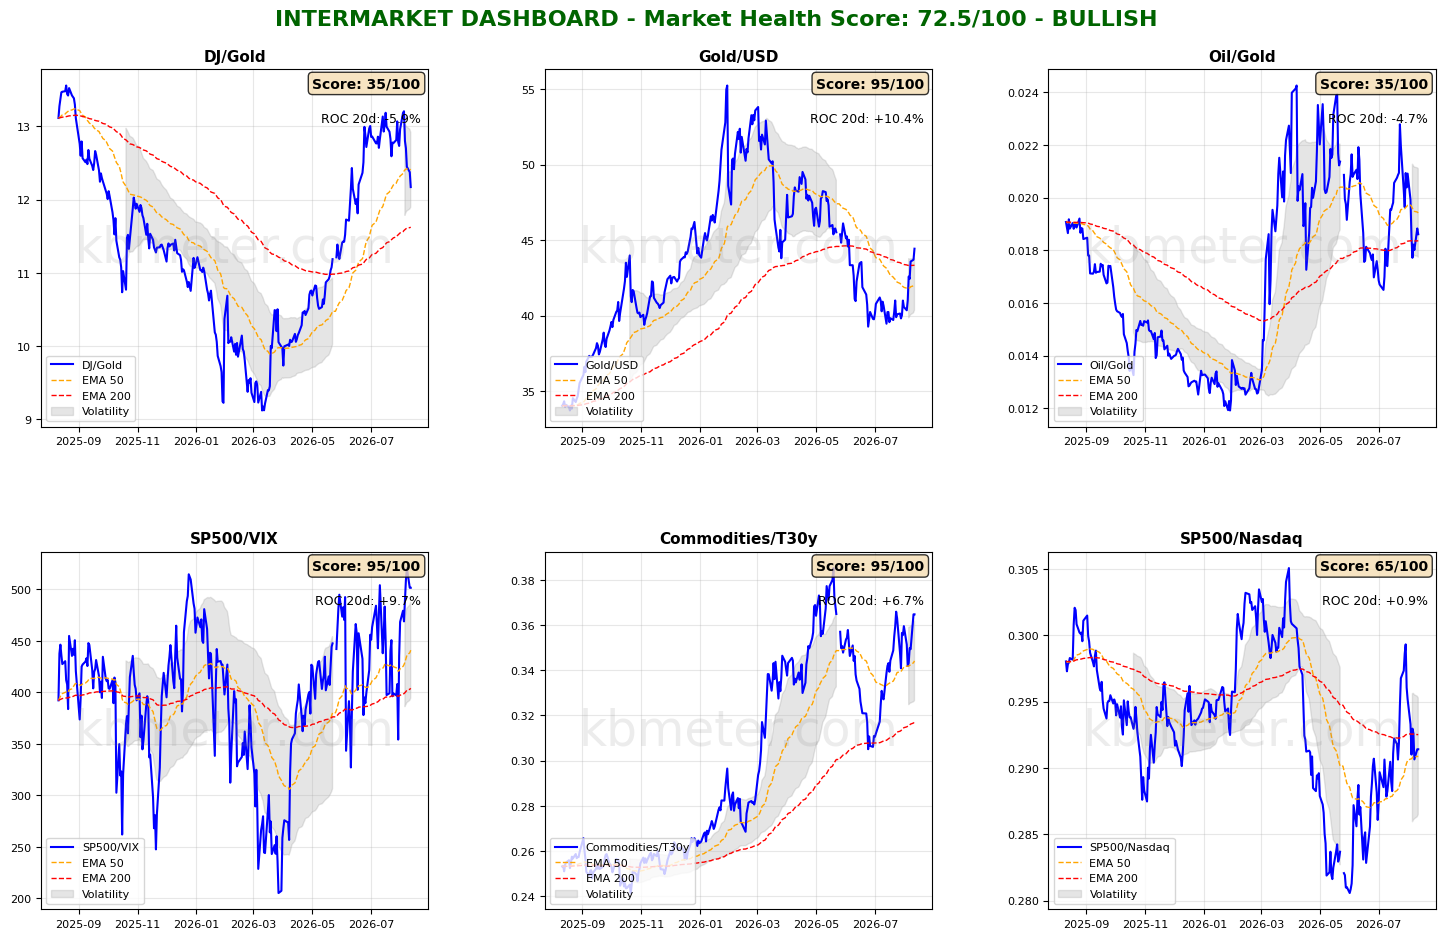
Financial markets are showing moderately positive sentiment today. Intermarket analysis highlights a Market Health Score of 72/100 (positive). Our intermarket dashboards continue to point to a more risk-on-oriented sentiment, with gold and oil appearing to be the main protagonists of the week.
Bullion continues to recover relative to both the US Dollar and the Dow, while the ratio versus oil remains stable. The performance of oil, combined with tomorrow’s US inflation data, could provide further fuel for a continued rise in gold prices. The key condition is that both the incoming data and the geopolitical situation provide signs of stabilization or easing inflationary pressures, reducing the likelihood that the Fed will need to raise interest rates.
The S&P 500/Nasdaq ratio remains relatively calm, as previously noted. The tech sector is expected to become more active later in the month as Nvidia’s quarterly earnings release approaches.
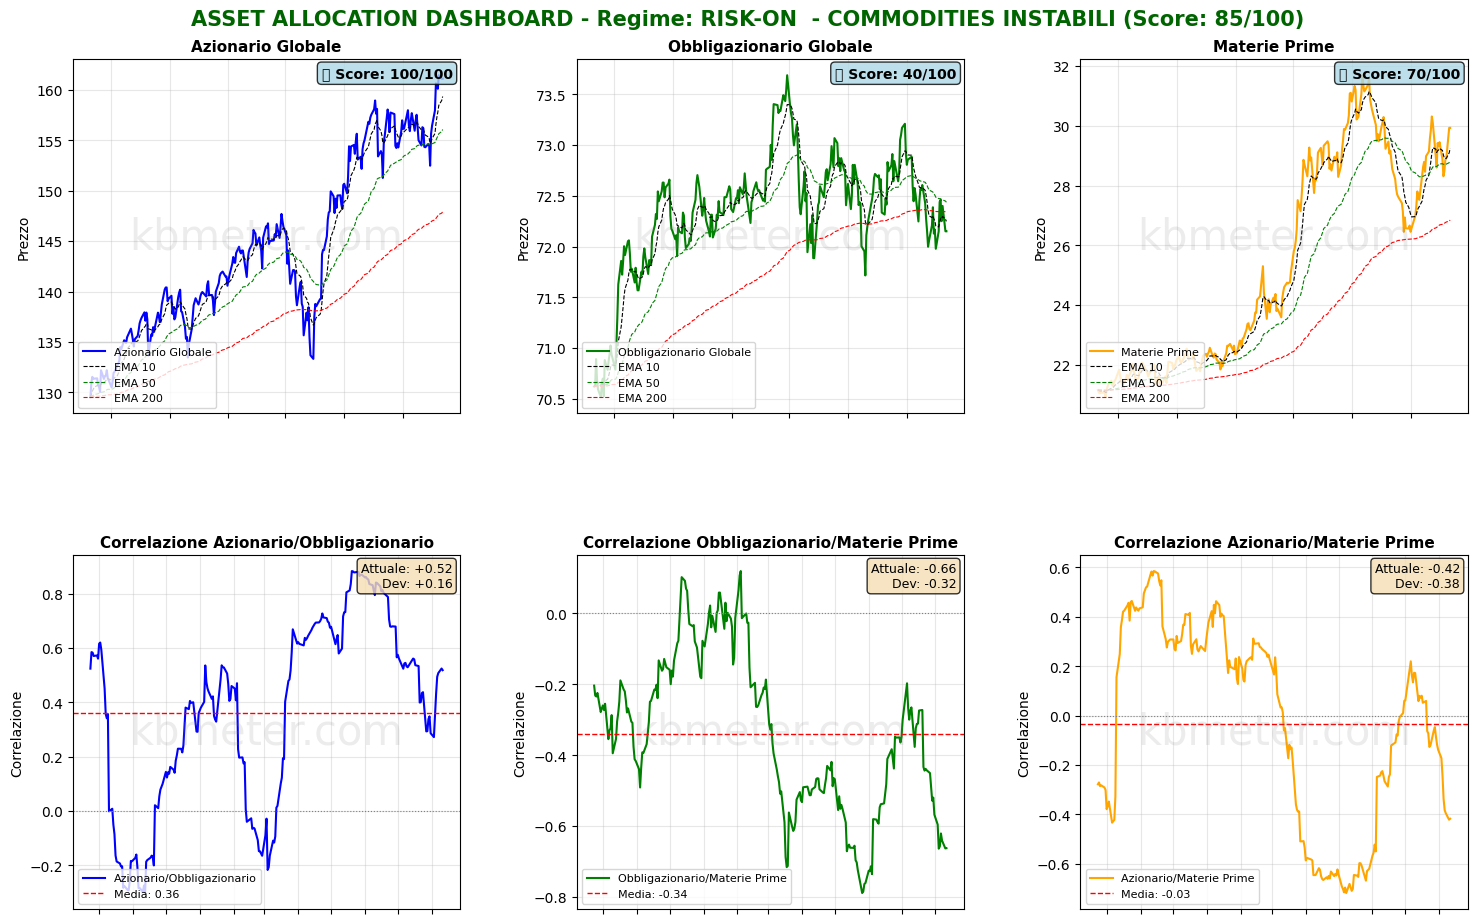
Asset classes continue to display fairly volatile price action in both fixed income and commodities, while global equities continue to attempt an August rally.
Our market “weather map” shows that equities and gold currently have the highest scores, while the US Dollar has slipped further below the 50-point threshold and the fixed income/crypto pair remains lagging.
The latest news from the Middle East, which has been less than encouraging, is contributing to increased volatility across commodities. Energy gains 5 points in a single session, with natural gas adding more than 8 points in one day, although it remains below the 50-point threshold.
Fixed-income volatility has also increased significantly, with the MOVE Index gaining 10 points in a single day and reaching a score of 60.
Global Futures – Pre-Market Sentiment
Pre-Market Futures: Global futures point to moderately risk-on sentiment (+0.07% average), with the US slightly positive (+0.20%), Europe slightly negative (-0.03%), and Asia slightly negative (-0.02%).
📊 Global Futures – Pre-Market Sentiment
- Nikkei 225: +0.61%
- Taiwan: +0.38%
- US Tech 100: +0.38%
- Hang Seng: -0.77%
- FTSE MIB: -0.21%
- IBEX 35: -0.09%
Macroeconomic calendar
The European macroeconomic calendar is relatively light today, with no major data releases scheduled. In Australia, the central bank announced its decision to leave interest rates unchanged, in line with expectations. In the US, the weekly ADP report and July 2026 existing home sales data are due to be released.
Already a subscriber? Login here
NOTES AND WARNINGS
Data compiled by kbmeter.com. Analysis date: 11 August 2026 - 8:19 AM GMT+1
This content is provided for informational purposes only and should not be considered financial advice. All scores and assessments are based on the previous trading day’s closing prices. Futures indications refer to the date and time of the analysis.
