
Financial Markets Start the Week on Edge Amid a Packed Macro Calendar and Key Earnings Reports
Financial markets open the week on edge as investors brace for a packed macroeconomic agenda. Attention is firmly on Wednesday’s Federal Reserve meeting and Friday’s key European economic data, with heavyweight earnings releases and lingering geopolitical tensions in between. A renewed clash between the United States and Canada, alongside persistent uncertainty surrounding Iran, adds to the fragile backdrop.
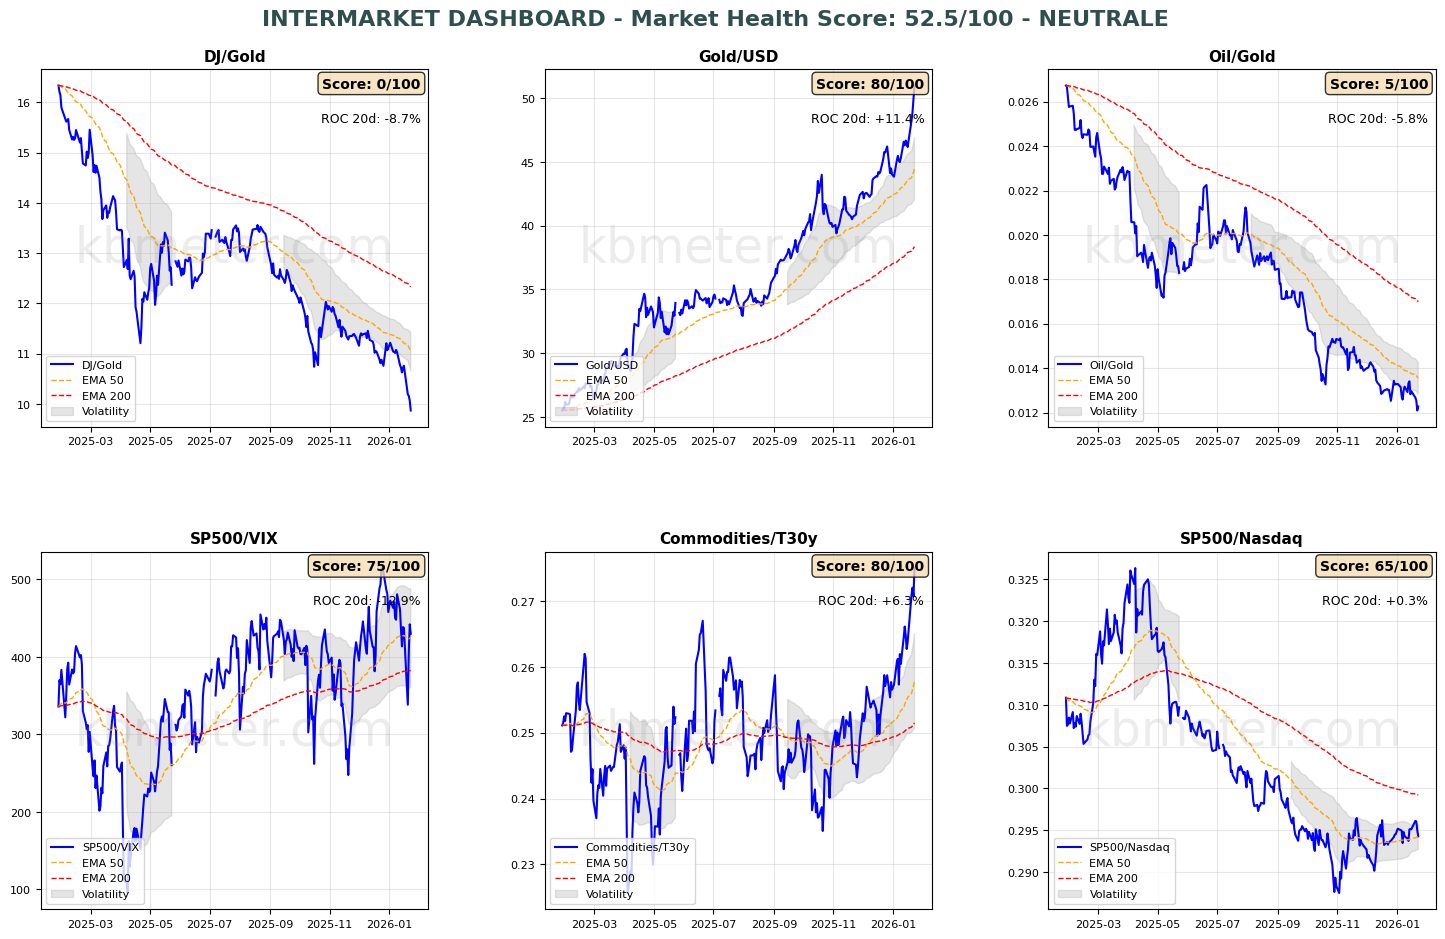
Futures point to a soft start to the week, with gold once again in the spotlight, the US dollar weakening, and a renewed uptick in oil and natural gas prices. Overall market sentiment sits between neutral and moderately positive. Intermarket analysis shows a Market Health Score of 52/100, consistent with a neutral stance.
Market Weather Map
January 26, 2026
US Equities
Eu Equities
Asia Equities
Commodities
Bonds
Dollar Index
Technology
Gold
Oil
Crypto
Market Summary
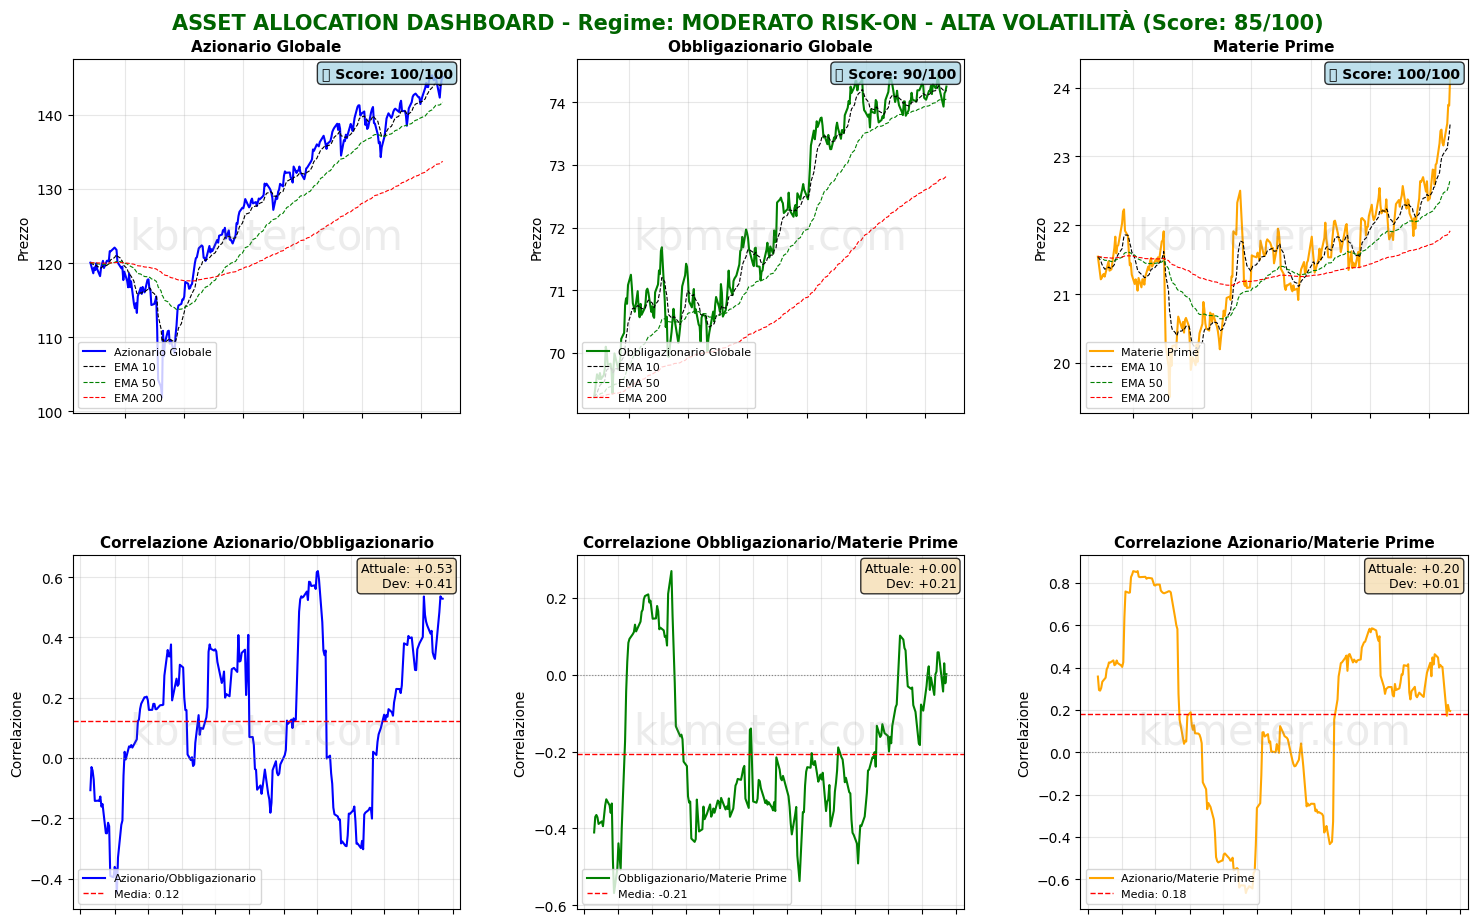
Our intermarket dashboards continue to highlight elevated uncertainty. Gold remains notably strong, while fresh concerns in the Middle East are lending support to oil prices. Risk indicators remain subdued. Across asset classes, both global equities and global bonds are hovering around their short-term moving averages, while the strength of precious metals is driving commodities sharply higher.
Pre-Market Futures: Global futures signal a moderate risk-off tone (-0.20% on average), with the US (-0.27%), Europe (-0.18%) and Asia (-0.14%) all slightly lower.
📊 Global Futures – Pre-Market Sentiment
- TecDAX derived: +0.23%
- Nikkei 225 derived: +0.05%
- FTSE 100 derived: +0.04%
- FTSE MIB derived: -0.58%
- IBEX 35 derived: -0.49%
- Russell 2000: -0.43%
📄 Detailed Intermarket Analysis
INTERMARKET ANALYSIS - 2026-01-26
============================================================

MARKET HEALTH SCORE: 52.5/100
SENTIMENT: NEUTRAL

============================================================
KEY RATIO SUMMARY
============================================================


DJ/Gold:
  - Component score: 0.0/100
  - Current value: 9.8667
  - Position vs EMA50: BELOW
  - 20-day ROC: -8.69%
  - 50-day ROC: -14.35%
  - ⚠️ ANOMALY DETECTED - Significant deviation from the mean
  → Flight to safe havens

Gold/USD:
  - Component score: 80.0/100
  - Current value: 50.9857
  - Position vs EMA50: ABOVE
  - 20-day ROC: +11.39%
  - 50-day ROC: +23.53%
  - ⚠️ ANOMALY DETECTED - Significant deviation from the mean

Oil/Gold:
  - Component score: 5.0/100
  - Current value: 0.0123
  - Position vs EMA50: BELOW
  - 20-day ROC: -5.76%
  - 50-day ROC: -16.08%
  → Weakening energy demand

SP500/VIX:
  - Component score: 75.0/100
  - Current value: 429.8079
  - Position vs EMA50: ABOVE
  - 20-day ROC: -12.92%
  - 50-day ROC: +10.72%

Commodities/T30y:
  - Component score: 80.0/100
  - Current value: 0.2750
  - Position vs EMA50: ABOVE
  - 20-day ROC: +6.28%
  - 50-day ROC: +9.14%
  - ⚠️ ANOMALY DETECTED - Significant deviation from the mean
  → Economic growth expectations

SP500/Nasdaq:
  - Component score: 65.0/100
  - Current value: 0.2943
  - Position vs EMA50: ABOVE
  - 20-day ROC: +0.34%
  - 50-day ROC: +1.33%

============================================================
CONCLUSIONS AND RECOMMENDATIONS
============================================================

The market is in a neutral / sideways phase. Mixed signals across the various ratios.
There is no clear directional bias. Waiting for confirmation is advised.
Positioning: BALANCED, avoid excesses.


STRONGEST RATIOS:
  • Gold/USD: 80.0/100
  • Commodities/T30y: 80.0/100
  • SP500/VIX: 75.0/100

WEAKEST RATIOS:
  • SP500/Nasdaq: 65.0/100
  • Oil/Gold: 5.0/100
  • DJ/Gold: 0.0/100

============================================================
Analysis automatically generated by kbmeter.com
Date: 2026-01-26
📄 Detailed Asset Allocation Analysis
ASSET ALLOCATION & REGIME ANALYSIS - 2026-01-26
======================================================================

MARKET REGIME: MODERATE RISK-ON - HIGH VOLATILITY
REGIME SCORE: 85.0/100

======================================================================
TREND AND VOLATILITY ANALYSIS
======================================================================

GLOBAL EQUITIES (ACWI):
  Short-Term Trend (5d): +0.11% | ABOVE EMA 10
  Medium-Term Trend (20d): +1.72% | ABOVE EMA 50
  Long-Term Trend (60d): +2.73% | ABOVE EMA 200

  Volatility 5d: 17.8%
  Volatility 20d: 10.2%
  Volatility 60d: 11.3%

COMMODITIES (DBC):
  Medium-Term Trend (20d): +6.85% | ABOVE EMA 50
  Volatility 20d: 14.7%

ACWI/BND Correlation (30d): 0.529

REGIME INTERPRETATION:
The market shows risk appetite, but with some elements of caution.
The trend remains constructive, though mixed signals may emerge across time horizons.
Suggested positioning: BALANCED with a slight tilt toward risk assets.

⚠️ VOLATILITY ALERT: Volatility is elevated or rising rapidly. This increases risk
even in the presence of positive trends. Reduce position sizing and increase
monitoring frequency.

======================================================================
ASSET RANKING - WHO IS PERFORMING BEST?
======================================================================

🥇 1. Global Equities (ACWI) - SCORE: 100/100
     Price: $145.16
     Trend: ABOVE EMA10 | ABOVE EMA50 | ABOVE EMA200
     Performance: 5d +0.11% | 20d +1.72% | 60d +2.73%
     Volatility: 5d 17.8% | 20d 10.2% | 60d 11.3%
     Drawdown: -0.15%
     → Asset in STRONG HEALTH: positive trends and controlled volatility

🥈 2. Commodities (DBC) - SCORE: 100/100
     Price: $24.18
     Trend: ABOVE EMA10 | ABOVE EMA50 | ABOVE EMA200
     Performance: 5d +4.40% | 20d +6.85% | 60d +10.64%
     Volatility: 5d 14.2% | 20d 14.7% | 60d 13.0%
     Drawdown: 0.00%
     → Asset in STRONG HEALTH: positive trends and controlled volatility

🥉 3. Global Bonds (BND) - SCORE: 90/100
     Price: $74.25
     Trend: ABOVE EMA10 | ABOVE EMA50 | ABOVE EMA200
     Performance: 5d +0.07% | 20d +0.08% | 60d -0.16%
     Volatility: 5d 4.0% | 20d 2.8% | 60d 3.0%
     Drawdown: -0.24%
     → Asset in STRONG HEALTH: positive trends and controlled volatility

======================================================================
CORRELATION ANALYSIS - CURRENT vs HISTORICAL
======================================================================

ACWI/BND:
  Current correlation (30d): +0.529
  Historical average (1 year): +0.122
  Deviation: +0.406
  ⚠️ SIGNIFICANT DEVIATION from historical average
  → Positive correlation: diversification COMPROMISED

BND/DBC:
  Current correlation (30d): +0.002
  Historical average (1 year): -0.206
  Deviation: +0.207

ACWI/DBC:
  Current correlation (30d): +0.195
  Historical average (1 year): +0.183
  Deviation: +0.012

======================================================================
OPERATIONAL SUMMARY
======================================================================

STRONGEST ASSET: Global Equities (Score: 100/100)
WEAKEST ASSET: Global Bonds (Score: 90/100)

SUGGESTED ACTION: Favor the strongest asset while maintaining risk exposure.
DIVERSIFICATION: EXCELLENT – Asset classes are moving independently.

======================================================================
Analysis automatically generated by kbmeter.com
Date: 2026-01-26
The macro week begins with German business confidence data for early 2026, followed by closely watched US releases on durable goods orders and the Chicago Fed National Activity Index (CFNAI).
The earnings calendar also gains traction as the week progresses. Today offers limited highlights, with Ryanair and a selection of US regional banks among the companies reporting.
Already a subscriber? Login here
NOTES AND WARNINGS
Data compiled by kbmeter.com. Analysis date: 26 January 2026 - 7:37 AM GMT+1
This content is provided for informational purposes only and should not be considered financial advice. All scores and assessments are based on the previous trading day’s closing prices. Futures indications refer to the date and time of the analysis.
