
Financial Markets Enter Holding Pattern; Sentiment Remains Neutral
Financial markets are attempting to stabilize after weeks of sharp turbulence. Current signals point to a waiting phase in which investors—having acknowledged the possibility of a prolonged conflict in the Middle East—are looking for guidance from central banks (with Australia making the first move this morning) and are closely listening to the figures presented by Nvidia’s CEO.
Market sentiment is moving more decisively into neutral territory, although volatility remains high. Futures indicate a weak opening for Europe and a negative one for the United States. Overall, financial markets today show a neutral to slightly negative sentiment.
Market Weather Map
March 17, 2026
US Equities
Eu Equities
Asia Equities
Commodities
Bonds
Dollar Index
Technology
Gold
Oil
Crypto
Market Summary
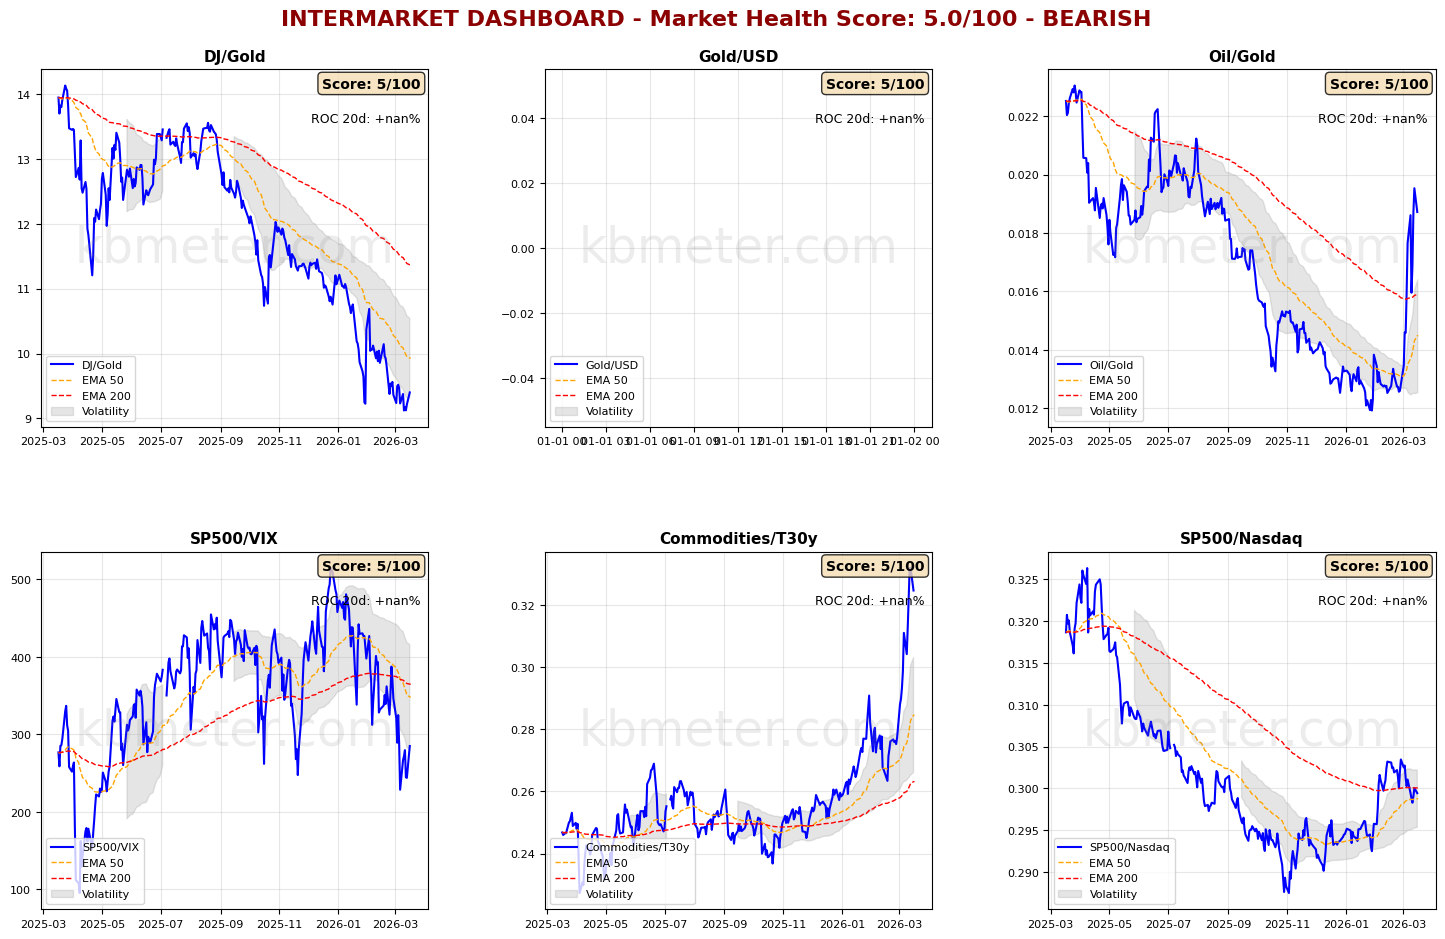
Intermarket analysis highlights a Market Health Score of 5/100 (negative). Our intermarket dashboards seem to confirm what was stated in yesterday’s analysis: after pricing in a prolonged conflict in the Middle East, financial markets now appear to be entering a stabilization phase, awaiting news or data that can help define direction in the coming weeks.
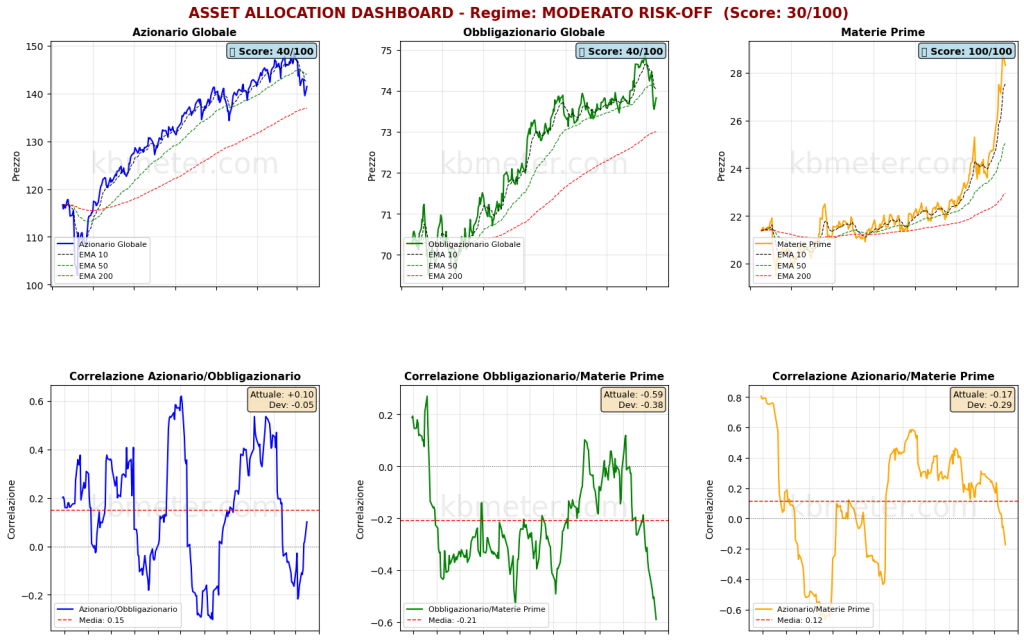
Risk appetite indicators remain in line with recent days, while the Oil-to-Gold ratio continues to hold firmly above its medium- and long-term moving averages. On the asset class front, we are observing an initial hold of key medium-term support levels for both bonds and equities.
As for our market “weather map,” the situation continues to indicate a phase of neutrality.
Pre-Opening Futures: Global futures point to a moderate risk-off sentiment (average -0.26%), with the US negative (-0.53%), Europe slightly negative (-0.08%), and Asia slightly negative (-0.46%).
📊 Global Futures – Pre-Opening Sentiment
- IBEX 35 derived: +0.63%
- TecDAX derived: +0.11%
- FTSE MIB derived: +0.06%
- Nikkei 225 derived: -1.44%
- Russell 2000: -0.82%
- DAX derived: -0.52%
📄 Detailed Intermarket Analysis
INTERMARKET ANALYSIS - 2026-03-17
============================================================

MARKET HEALTH SCORE: 5.0/100
SENTIMENT: BEARISH

============================================================
MAIN RATIOS SUMMARY
============================================================


DJ/Gold:
  - Component score: 5.0/100
  - Current value: nan
  - Position vs EMA50: BELOW
  - 20-day ROC: +nan%
  - 50-day ROC: +nan%
  → Flight to safe haven

Gold/USD:
  - Component score: 5.0/100
  - Current value: nan
  - Position vs EMA50: BELOW
  - 20-day ROC: +nan%
  - 50-day ROC: +nan%

Oil/Gold:
  - Component score: 5.0/100
  - Current value: nan
  - Position vs EMA50: BELOW
  - 20-day ROC: +nan%
  - 50-day ROC: +nan%
  → Declining energy demand

SP500/VIX:
  - Component score: 5.0/100
  - Current value: nan
  - Position vs EMA50: BELOW
  - 20-day ROC: +nan%
  - 50-day ROC: +nan%

Commodities/T30y:
  - Component score: 5.0/100
  - Current value: nan
  - Position vs EMA50: BELOW
  - 20-day ROC: +nan%
  - 50-day ROC: +nan%
  → Slowdown expectations

SP500/Nasdaq:
  - Component score: 5.0/100
  - Current value: nan
  - Position vs EMA50: BELOW
  - 20-day ROC: +nan%
  - 50-day ROC: +nan%

============================================================
CONCLUSIONS AND RECOMMENDATIONS
============================================================

The market is in bearish territory. Signs of widespread stress.
Risk-off behavior underway. Maximum caution advised.
Positioning: VERY DEFENSIVE, capital preservation.


STRONGEST RATIOS:
  • DJ/Gold: 5.0/100
  • Gold/USD: 5.0/100
  • Oil/Gold: 5.0/100

WEAKEST RATIOS:
  • SP500/VIX: 5.0/100
  • Commodities/T30y: 5.0/100
  • SP500/Nasdaq: 5.0/100

============================================================
Analysis automatically generated by kbmeter.com
Date: 2026-03-17
📄 Detailed Asset Allocation Analysis
ASSET ALLOCATION & REGIME ANALYSIS - 2026-03-17
======================================================================

MARKET REGIME: MODERATE RISK-OFF
REGIME SCORE: 30.0/100

======================================================================
TREND AND VOLATILITY ANALYSIS
======================================================================

GLOBAL EQUITIES (ACWI):
  Short-Term Trend (5d): -1.10% | BELOW EMA 10
  Medium-Term Trend (20d): -3.10% | BELOW EMA 50
  Long-Term Trend (60d): +2.11% | ABOVE EMA 200

  Volatility 5d: 18.0%
  Volatility 20d: 15.1%
  Volatility 60d: 13.0%

COMMODITIES (DBC):
  Medium-Term Trend (20d): +20.01% | ABOVE EMA 50
  Volatility 20d: 22.8%

Correlation ACWI/BND (30d): 0.101

REGIME INTERPRETATION:
The market is showing signs of caution. Trends are deteriorating across some time horizons
or volatility is increasing. Investors are reducing risk exposure.
Suggested positioning: UNDERWEIGHT equities, favor quality and defensive assets.

======================================================================
ASSET RANKING - WHO IS PERFORMING BEST?
======================================================================

🥇 1. Commodities (DBC) - SCORE: 100/100
     Price: $28.31
     Trend: ABOVE EMA10 | ABOVE EMA50 | ABOVE EMA200
     Performance: 5d +2.57% | 20d +20.01% | 60d +28.06%
     Volatility: 5d 27.3% | 20d 22.8% | 60d 22.3%
     Drawdown: -1.91%
     → Asset in STRONG CONDITION: positive trends and controlled volatility

🥈 2. Global Equities (ACWI) - SCORE: 40/100
     Price: $141.48
     Trend: BELOW EMA10 | BELOW EMA50 | ABOVE EMA200
     Performance: 5d -1.10% | 20d -3.10% | 60d +2.11%
     Volatility: 5d 18.0% | 20d 15.1% | 60d 13.0%
     Drawdown: -4.82%
     → Asset in WEAK CONDITION: negative trends or elevated volatility

🥉 3. Global Bonds (BND) - SCORE: 40/100
     Price: $73.83
     Trend: BELOW EMA10 | BELOW EMA50 | ABOVE EMA200
     Performance: 5d -0.53% | 20d -1.09% | 60d +0.41%
     Volatility: 5d 5.3% | 20d 3.6% | 60d 3.2%
     Drawdown: -1.48%
     → Asset in WEAK CONDITION: negative trends or elevated volatility

======================================================================
CORRELATION ANALYSIS - CURRENT vs HISTORICAL
======================================================================

ACWI/BND:
  Current correlation (30d): +0.101
  Historical average (1 year): +0.152
  Deviation: -0.051
  → Weak correlation: moderate diversification

BND/DBC:
  Current correlation (30d): -0.589
  Historical average (1 year): -0.208
  Deviation: -0.381
  ⚠️ SIGNIFICANT DEVIATION from historical average

ACWI/DBC:
  Current correlation (30d): -0.172
  Historical average (1 year): +0.117
  Deviation: -0.290
  → Negative correlation: possible supply-driven shift

======================================================================
OPERATIONAL SUMMARY
======================================================================

STRONGEST ASSET: Commodities (Score: 100/100)
WEAKEST ASSET: Global Bonds (Score: 40/100)

SUGGESTED ACTION: Reduce exposure to the weakest asset, favor defensive positioning.
DIVERSIFICATION: EXCELLENT - Asset classes are moving independently.

======================================================================
Analysis automatically generated by kbmeter.com
Date: 2026-03-17
On the macro side, the day opened with the Australian central bank’s decision to raise interest rates (a move that was expected). Among other data scheduled for today, noteworthy releases include the ZEW survey update on investor confidence in Germany and the Eurozone, as well as the weekly ADP report on new employment in the United States.
Already a subscriber? Login here
NOTES AND WARNINGS
Data compiled by kbmeter.com. Analysis date: 17 March 2026 - 7:35 AM GMT+1
This content is provided for informational purposes only and should not be considered financial advice. All scores and assessments are based on the previous trading day’s closing prices. Futures indications refer to the date and time of the analysis.
