
Financial Markets Enter Central Bank Week as Stabilization Signs Emerge but Sentiment Remains Cautious
Financial markets begin the week still carrying the aftereffects of several difficult sessions. Sentiment continues to fluctuate between neutral and moderately negative, although the hypothesis is starting to gain traction that investors have already priced in a potential conflict in Iran and a prolonged period of elevated oil prices.
In this context, the decisions of the major central banks will arrive in the coming days, starting with the Federal Reserve. Some insights may also emerge from the AI sector, with the highly anticipated GTC Conference kicking off today. Futures currently indicate an uncertain opening for Europe and a positive one for the United States.
Market Weather Map
March 16, 2026
US Equities
Eu Equities
Asia Equities
Commodities
Bonds
Dollar Index
Technology
Gold
Oil
Crypto
Market Summary
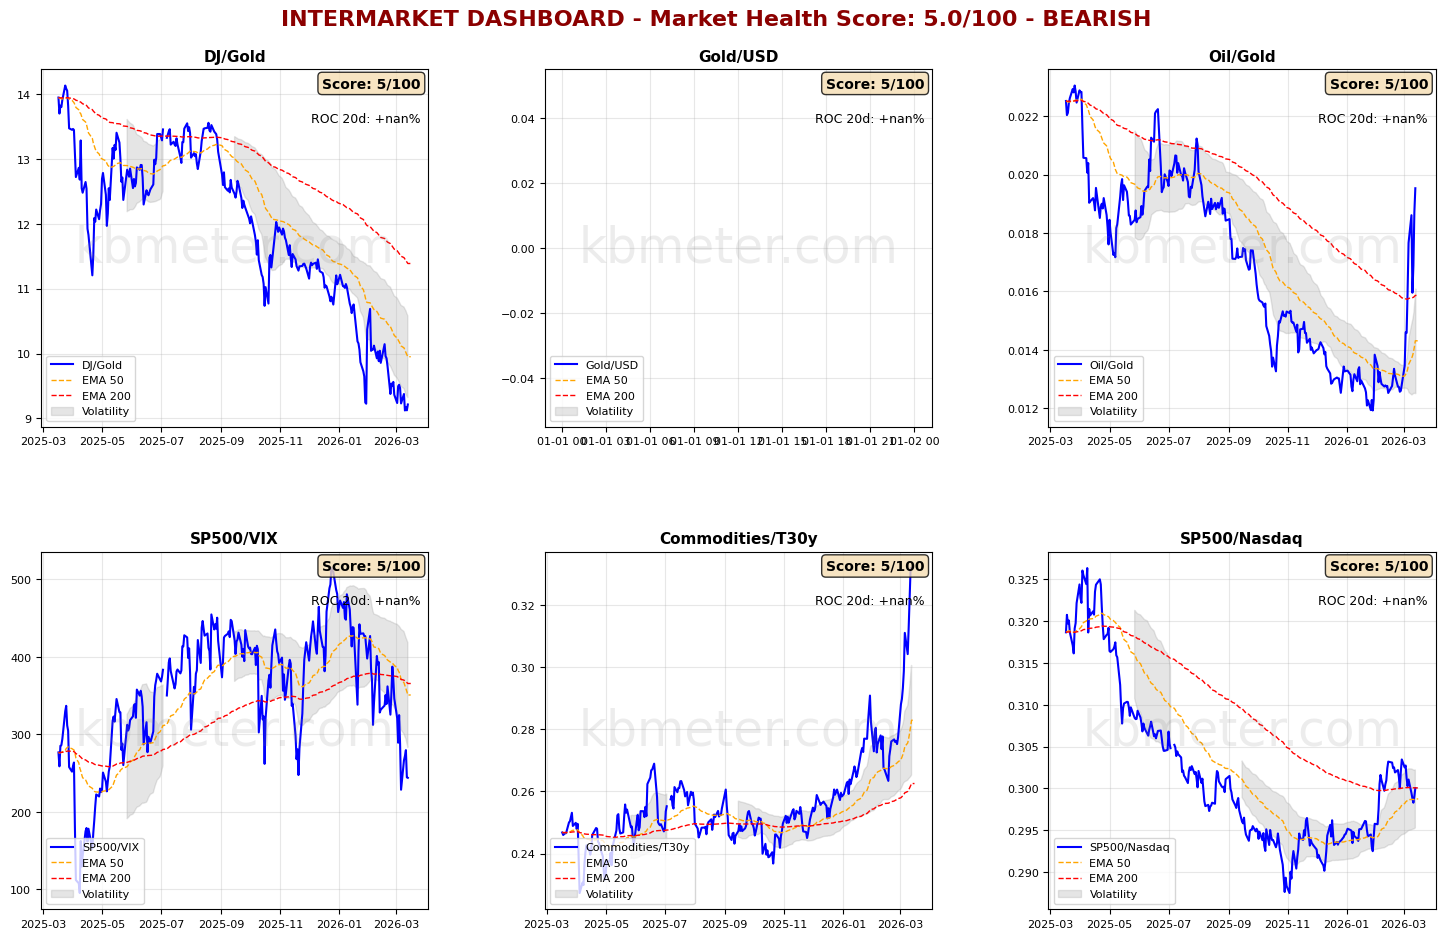
Financial markets today show a neutral sentiment. Intermarket analysis highlights a Market Health Score of 5/100, indicating a negative environment.
Our intermarket dashboards continue to signal the major anomaly troubling markets in recent weeks: the price of oil. The Oil/Gold ratio remains above its long-term moving average, while the commodities to long-term Treasuries ratio continues to trade near its highest levels in at least a year. Risk appetite indicators remain congested, with the S&P 500/VIX ratio seeing the 50-day moving average crossing below the long-term average — a bearish signal.
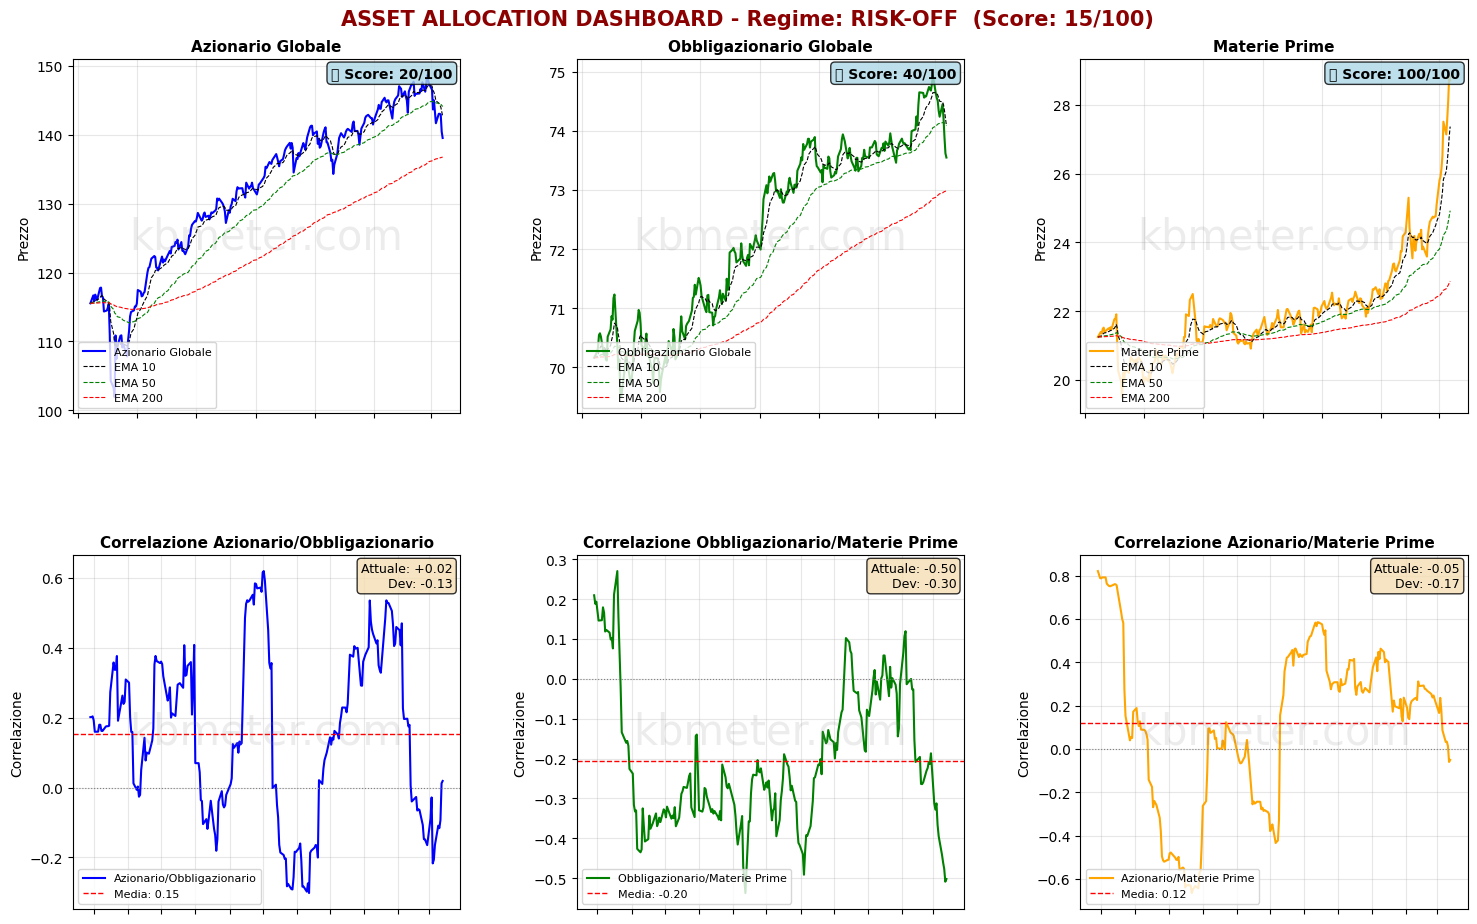
The situation across the main asset classes remains fragile. Both global equities and global bonds are trading below their 50-day moving averages, with the long-term averages approaching. The correlation between the two asset classes has moved back above zero, reducing the diversification benefits of the traditional 60/40 portfolio.
Our market “weather map” suggests the possibility of stabilization, with none of the monitored assets signaling further downside acceleration and no scores above 60 points. It is still too early to draw firm conclusions, but at first glance it could be said that investors have almost fully priced in a prolonged conflict in Iran and sustained oil prices for a significant period.
Pre-Market Futures: Global futures point to a moderately risk-on sentiment (average +0.18%), with the US positive (+0.57%), Europe slightly negative (-0.13%), and Asia positive (+0.59%).
📊 Global Futures – Pre-Market Sentiment
- Hang Seng derived: +1.23%
- Russell 2000: +0.81%
- Nikkei 225 derived: +0.57%
- CAC 40 derived: -0.91%
- IBEX 35 derived: -0.41%
- FTSE MIB derived: -0.31%
📄 Detailed Intermarket Analysis
INTERMARKET ANALYSIS - 2026-03-16
============================================================

MARKET HEALTH SCORE: 5.0/100
SENTIMENT: BEARISH

============================================================
SUMMARY OF MAIN RATIOS
============================================================


DJ/Gold:
  - Component score: 5.0/100
  - Current value: nan
  - Position vs EMA50: BELOW
  - 20-day ROC: +nan%
  - 50-day ROC: +nan%
  → Flight to safe haven

Gold/USD:
  - Component score: 5.0/100
  - Current value: nan
  - Position vs EMA50: BELOW
  - 20-day ROC: +nan%
  - 50-day ROC: +nan%

Oil/Gold:
  - Component score: 5.0/100
  - Current value: nan
  - Position vs EMA50: BELOW
  - 20-day ROC: +nan%
  - 50-day ROC: +nan%
  → Declining energy demand

SP500/VIX:
  - Component score: 5.0/100
  - Current value: nan
  - Position vs EMA50: BELOW
  - 20-day ROC: +nan%
  - 50-day ROC: +nan%

Commodities/T30y:
  - Component score: 5.0/100
  - Current value: nan
  - Position vs EMA50: BELOW
  - 20-day ROC: +nan%
  - 50-day ROC: +nan%
  → Expectations of slowdown

SP500/Nasdaq:
  - Component score: 5.0/100
  - Current value: nan
  - Position vs EMA50: BELOW
  - 20-day ROC: +nan%
  - 50-day ROC: +nan%

============================================================
CONCLUSIONS AND RECOMMENDATIONS
============================================================

The market is in bearish territory. Widespread signs of stress.
A flight from risk is underway. Maximum caution advised.
Positioning: VERY DEFENSIVE, capital preservation.


STRONGEST RATIOS:
  • DJ/Gold: 5.0/100
  • Gold/USD: 5.0/100
  • Oil/Gold: 5.0/100

WEAKEST RATIOS:
  • SP500/VIX: 5.0/100
  • Commodities/T30y: 5.0/100
  • SP500/Nasdaq: 5.0/100

============================================================
Analysis automatically generated by kbmeter.com
Date: 2026-03-16
📄 Detailed Asset Allocation Analysis
ASSET ALLOCATION & REGIME ANALYSIS - 2026-03-16
======================================================================

MARKET REGIME: RISK-OFF
REGIME SCORE: 15.0/100

======================================================================
TREND AND VOLATILITY ANALYSIS
======================================================================

GLOBAL EQUITIES (ACWI):
  Short Trend (5d): -2.45% | BELOW EMA 10
  Medium Trend (20d): -4.39% | BELOW EMA 50
  Long Trend (60d): -0.32% | ABOVE EMA 200

  Volatility 5d: 15.8%
  Volatility 20d: 14.0%
  Volatility 60d: 12.7%

COMMODITIES (DBC):
  Medium Trend (20d): +20.23% | ABOVE EMA 50
  Volatility 20d: 21.4%

ACWI/BND Correlation (30d): 0.019

REGIME INTERPRETATION:
The market is in a risk-off regime. Negative trends across multiple horizons and/or elevated volatility. Flight to safe assets.
Suggested positioning: DEFENSIVE, capital protection.

======================================================================
ASSET RANKING - WHO IS PERFORMING BEST?
======================================================================

🥇 1. Commodities (DBC) - SCORE: 100/100
     Price: $28.71
     Trend: ABOVE EMA10 | ABOVE EMA50 | ABOVE EMA200
     Performance: 5d +5.78% | 20d +20.23% | 60d +31.43%
     Volatility: 5d 27.0% | 20d 21.4% | 60d 22.1%
     Drawdown: -0.52%
     → Asset in STRONG HEALTH: positive trends and controlled volatility

🥈 2. Global Bonds (BND) - SCORE: 40/100
     Price: $73.55
     Trend: BELOW EMA10 | BELOW EMA50 | ABOVE EMA200
     Performance: 5d -1.21% | 20d -1.48% | 60d +0.01%
     Volatility: 5d 4.6% | 20d 3.5% | 60d 3.1%
     Drawdown: -1.86%
     → Asset in WEAK conditions: negative trends or elevated volatility

🥉 3. Global Equities (ACWI) - SCORE: 20/100
     Price: $139.54
     Trend: BELOW EMA10 | BELOW EMA50 | ABOVE EMA200
     Performance: 5d -2.45% | 20d -4.39% | 60d -0.32%
     Volatility: 5d 15.8% | 20d 14.0% | 60d 12.7%
     Drawdown: -6.13%
     → Asset in DIFFICULTY: avoid or heavily underweight

======================================================================
CORRELATION ANALYSIS - CURRENT vs HISTORICAL
======================================================================

ACWI/BND:
  Current correlation (30d): +0.019
  Historical average (1 year): +0.152
  Deviation: -0.133
  → Weak correlation: moderate diversification

BND/DBC:
  Current correlation (30d): -0.502
  Historical average (1 year): -0.205
  Deviation: -0.297

ACWI/DBC:
  Current correlation (30d): -0.050
  Historical average (1 year): +0.122
  Deviation: -0.172
  → Negative correlation: possible supply-driven shift

======================================================================
OPERATIONAL SUMMARY
======================================================================

STRONGEST ASSET: Commodities (Score: 100/100)
WEAKEST ASSET: Global Equities (Score: 20/100)

SUGGESTED ACTION: Reduce exposure to the weakest asset, favor defensive positioning.
DIVERSIFICATION: EXCELLENT - Asset classes are moving independently.

======================================================================
Analysis automatically generated by kbmeter.com
Date: 2026-03-16
On the macro front, today’s calendar includes data on the performance of the Chinese economy in the first two months of 2026, Canada’s February 2026 inflation, the update of the NY Empire State Index, and the US industrial production figures for February 2026.
Already a subscriber? Login here
NOTES AND WARNINGS
Data compiled by kbmeter.com. Analysis date: 16 March 2026 - 7:16 AM GMT+1
This content is provided for informational purposes only and should not be considered financial advice. All scores and assessments are based on the previous trading day’s closing prices. Futures indications refer to the date and time of the analysis.
