
Financial Markets End Week with Cautious Optimism Amid Tech Strength and Geopolitical Hopes
The week closes once again with the Middle East taking center stage. After several difficult days, a diplomatic solution now appears to be very close, and financial markets remain on standby for positive developments. Risk-on sentiment is strengthening, driven mainly by solid corporate earnings continuing to emerge from the technology sector (Dell). What is still missing, however, is the other leg of the story: a moderation in inflation expectations significant enough to prevent growth from derailing. In this respect, today’s May inflation data from the main Eurozone economies will be particularly important.
Meanwhile, global bonds have moved back above their medium-term moving average, while commodities are losing ground, dragged lower by oil prices. Volatility remains contained. Futures point to a slightly positive opening for Europe and a flat start for the United States.
Market Weather Map
May 29, 2026
US Equities
Eu Equities
Asia Equities
Commodities
Bonds
Dollar Index
Technology
Gold
Oil
Crypto
Market Summary
Do you want to see the score details for all assets monitored by KBMeter?
Try free for 14 days →Financial markets sentiment
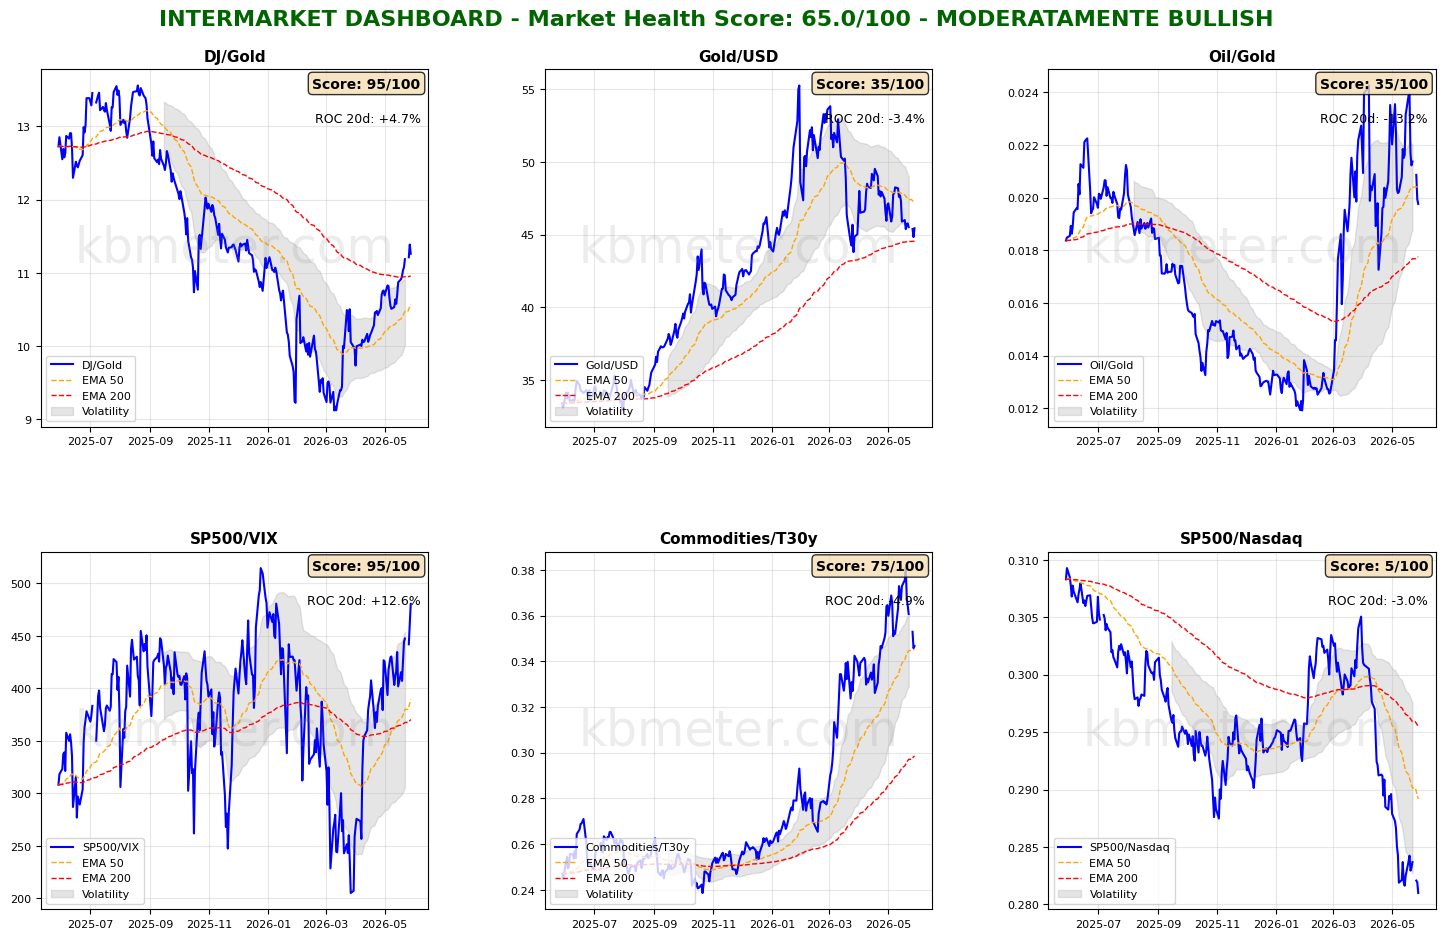
Financial markets are showing a moderately positive sentiment today. Intermarket analysis highlights a Market Health Score of 65/100 (moderately positive). Our intermarket dashboards reveal several interesting elements that help explain what is currently happening among investors.
First of all, there is a clear improvement in risk-on positioning: the Dow/Gold, S&P 500/VIX, and S&P 500/Nasdaq ratios are all accelerating in the direction of greater risk appetite. Gold’s rebound has halted the decline of the Gold/Dollar ratio below its 50-day moving average, while oil prices continue to weaken amid the imminent — barring surprises — agreement between the United States and Iran.
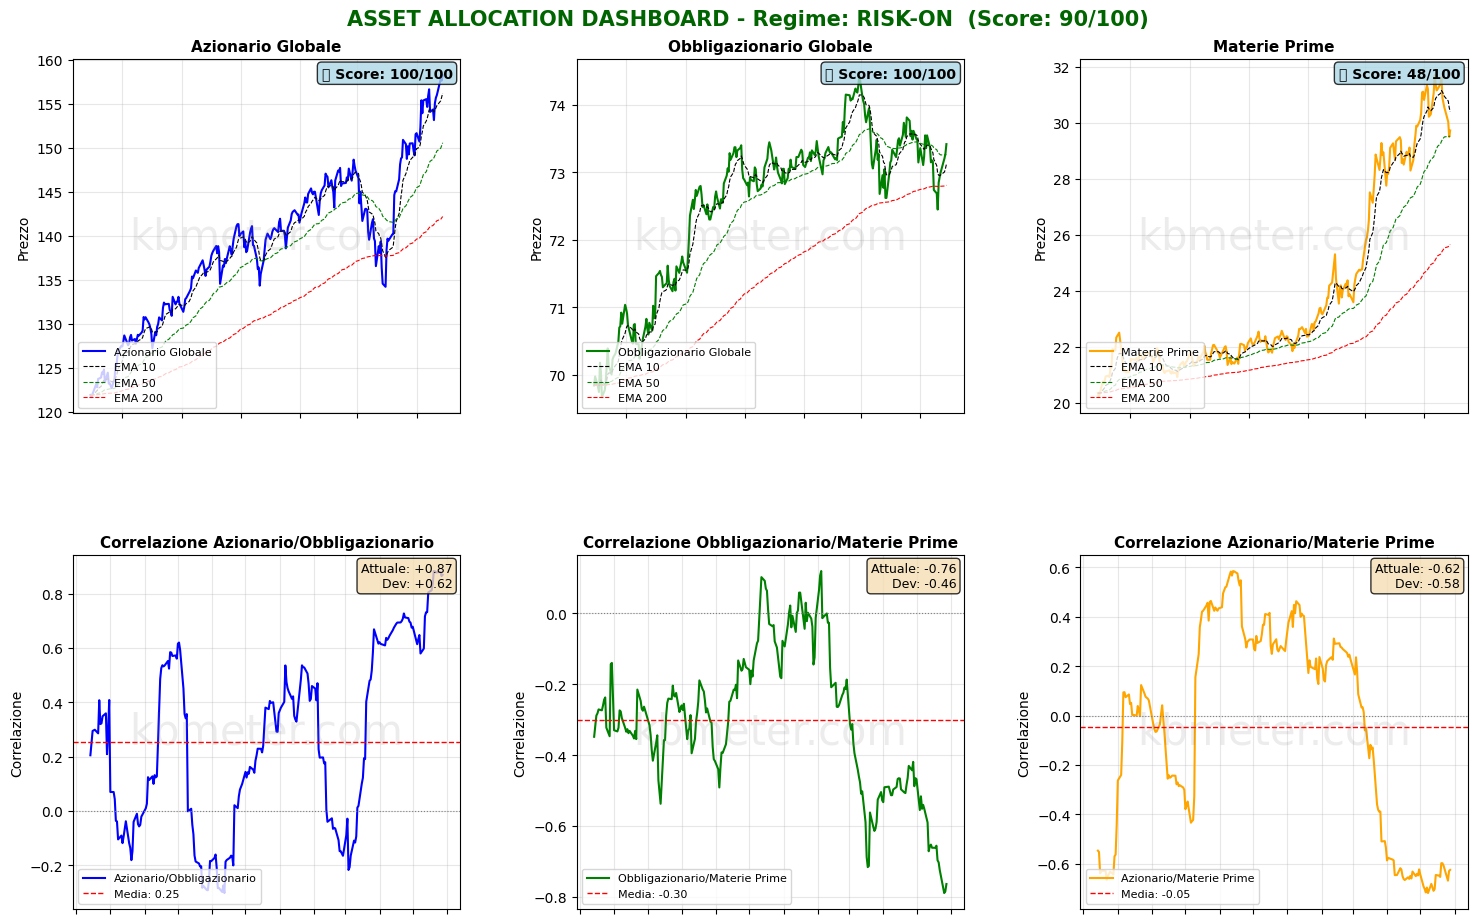
Looking at the various asset classes, besides the continuation of the equity rally and commodities finding support at their medium-term moving average, the main development comes from global bonds, which have crossed back above the 50-day moving average. Optimism surrounding the Middle East and reasonably encouraging inflation data appear, for the moment, to be calming the rise in yields.
Finally, looking at our health scores, we note the sharp decline in oil prices, the continuation of the difficult phase for cryptocurrencies, and the resilience of the U.S. dollar.
Global Futures – Pre-Market Sentiment
Pre-Market Futures: Global futures are signaling a moderate risk-on sentiment (+0.26% on average), with the U.S. slightly positive (+0.02%), Europe slightly positive (+0.31%), and Asia slightly positive (+0.47%).
📊 Global Futures – Pre-Market Sentiment
- TecDAX derived: +1.24%
- Nikkei 225 derived: +0.88%
- FTSE MIB derived: +0.49%
- IBEX 35 derived: -0.28%
- Russell 2000: -0.15%
- Mini MDAX derived: +0.00%
Intermarket details
📄 Detailed Intermarket Analysis
INTERMARKET ANALYSIS - 2026-05-29
============================================================

MARKET HEALTH SCORE: 65.0/100
SENTIMENT: MODERATELY BULLISH

============================================================
SUMMARY OF MAIN RATIOS
============================================================


DJ/Gold:
  - Component score: 95.0/100
  - Current value: 11.2615
  - Position vs EMA50: ABOVE
  - 20-day ROC: +4.67%
  - 50-day ROC: +19.13%
  → Preference for risky assets vs safe havens

Gold/USD:
  - Component score: 35.0/100
  - Current value: 45.4383
  - Position vs EMA50: BELOW
  - 20-day ROC: -3.43%
  - 50-day ROC: -6.99%

Oil/Gold:
  - Component score: 35.0/100
  - Current value: 0.0198
  - Position vs EMA50: BELOW
  - 20-day ROC: -13.22%
  - 50-day ROC: +0.31%
  → Declining energy demand

SP500/VIX:
  - Component score: 95.0/100
  - Current value: 480.5356
  - Position vs EMA50: ABOVE
  - 20-day ROC: +12.58%
  - 50-day ROC: +82.00%
  → Expanding risk appetite

Commodities/T30y:
  - Component score: 75.0/100
  - Current value: 0.3466
  - Position vs EMA50: ABOVE
  - 20-day ROC: -4.92%
  - 50-day ROC: +2.19%
  → Economic growth expectations

SP500/Nasdaq:
  - Component score: 5.0/100
  - Current value: 0.2810
  - Position vs EMA50: BELOW
  - 20-day ROC: -2.97%
  - 50-day ROC: -6.04%

============================================================
CONCLUSIONS AND RECOMMENDATIONS
============================================================

The market remains moderately constructive. Some ratios are showing positive signals,
but elements of caution persist. Monitor developments closely.
Positioning: SELECTIVE, favor quality.


STRONGEST RATIOS:
  • DJ/Gold: 95.0/100
  • SP500/VIX: 95.0/100
  • Commodities/T30y: 75.0/100

WEAKEST RATIOS:
  • Gold/USD: 35.0/100
  • Oil/Gold: 35.0/100
  • SP500/Nasdaq: 5.0/100

============================================================
Data processed by kbmeter.com
Date: 2026-05-29
📄 Detailed Asset Allocation Analysis
ASSET ALLOCATION & REGIME ANALYSIS - 2026-05-29
======================================================================

MARKET REGIME: RISK-ON
REGIME SCORE: 90.0/100

======================================================================
TREND AND VOLATILITY ANALYSIS
======================================================================

GLOBAL EQUITIES (ACWI):
  Short-Term Trend (5d): +1.64% | ABOVE EMA 10
  Medium-Term Trend (20d): +4.43% | ABOVE EMA 50
  Long-Term Trend (60d): +9.14% | ABOVE EMA 200

  5d Volatility: 7.7%
  20d Volatility: 14.6%
  60d Volatility: 17.5%

COMMODITIES (DBC):
  Medium-Term Trend (20d): -4.44% | ABOVE EMA 50
  20d Volatility: 22.6%

ACWI/BND Correlation (30d): 0.870

REGIME INTERPRETATION:
The market is currently in a risk-on regime. Equities are showing positive trends across multiple
time horizons and volatility remains contained. Investors are favoring risk assets.
Suggested positioning: OVERWEIGHT equities.

======================================================================
ASSET RANKING - WHO IS PERFORMING BEST?
======================================================================

🥇 1. Global Equities (ACWI) - SCORE: 100/100
     Price: $158.25
     Trend: ABOVE EMA10 | ABOVE EMA50 | ABOVE EMA200
     Performance: 5d +1.64% | 20d +4.43% | 60d +9.14%
     Volatility: 5d 7.7% | 20d 14.6% | 60d 17.5%
     Drawdown: 0.00%
     → Asset in STRONG HEALTH: positive trends and controlled volatility

🥈 2. Global Bonds (BND) - SCORE: 100/100
     Price: $73.42
     Trend: ABOVE EMA10 | ABOVE EMA50 | ABOVE EMA200
     Performance: 5d +0.67% | 20d +0.22% | 60d -0.80%
     Volatility: 5d 1.3% | 20d 4.5% | 60d 4.6%
     Drawdown: -1.37%
     → Asset in STRONG HEALTH: positive trends and controlled volatility

🥉 3. Commodities (DBC) - SCORE: 48/100
     Price: $29.72
     Trend: BELOW EMA10 | ABOVE EMA50 | ABOVE EMA200
     Performance: 5d -3.19% | 20d -4.44% | 60d +13.70%
     Volatility: 5d 16.6% | 20d 22.6% | 60d 25.1%
     Drawdown: -6.22%
     → Asset in NEUTRAL condition: mixed signals

======================================================================
CORRELATION ANALYSIS - CURRENT vs HISTORICAL
======================================================================

ACWI/BND:
  Current Correlation (30d): +0.870
  Historical Average (1 year): +0.255
  Deviation: +0.615
  ⚠️ SIGNIFICANT DEVIATION from historical average
  → Positive correlation: diversification COMPROMISED

BND/DBC:
  Current Correlation (30d): -0.764
  Historical Average (1 year): -0.302
  Deviation: -0.461
  ⚠️ SIGNIFICANT DEVIATION from historical average

ACWI/DBC:
  Current Correlation (30d): -0.625
  Historical Average (1 year): -0.045
  Deviation: -0.579
  ⚠️ SIGNIFICANT DEVIATION from historical average
  → Negative correlation: possible supply-driven shift

======================================================================
OPERATIONAL SUMMARY
======================================================================

STRONGEST ASSET: Global Equities (Score: 100/100)
WEAKEST ASSET: Commodities (Score: 48/100)

SUGGESTED ACTION: Favor the strongest asset, maintain risk exposure.
DIVERSIFICATION: WEAK - Asset classes tend to move together.

======================================================================
Data processed by kbmeter.com
Date: 2026-05-29
Macroeconomic calendar
On the macro front, today’s agenda includes retail sales and industrial production data from Japan, as well as an important update on inflation trends (May 2026) across the main Eurozone economies. First-quarter growth data from Canada are also due for release.
Already a subscriber? Login here
NOTES AND WARNINGS
Data compiled by kbmeter.com. Analysis date: 29 May 2026 - 7:54 AM GMT+1
This content is provided for informational purposes only and should not be considered financial advice. All scores and assessments are based on the previous trading day’s closing prices. Futures indications refer to the date and time of the analysis.
