
Financial Markets Digest US Midterm Results: Trump Trades, Gold and Dollar in Focus
Financial markets will have to digest the outcome of the US midterm elections. The Democrats’ decisive victory could initially weigh on Trump Trades, particularly growth stocks and cryptocurrencies. Market sentiment remains in neutral territory and, once again, corporate earnings (including AMD’s strong results) have failed to reignite enthusiasm for the technology sector.
The US dollar is losing momentum compared with previous weeks, while gold is attempting a recovery (although our scores have yet to register any significant improvement). Gold and the US dollar will therefore be the key indicators to monitor over the coming days. Futures point to a slightly negative opening for both US and European markets.
Market Weather Map
November 4, 2026
US Equities
Eu Equities
Asia Equities
Commodities
Bonds
Dollar Index
Technology
Gold
Oil
Crypto
Market Summary
Do you want to see the score details for all assets monitored by KBMeter?
Try free for 14 days →Financial markets sentiment
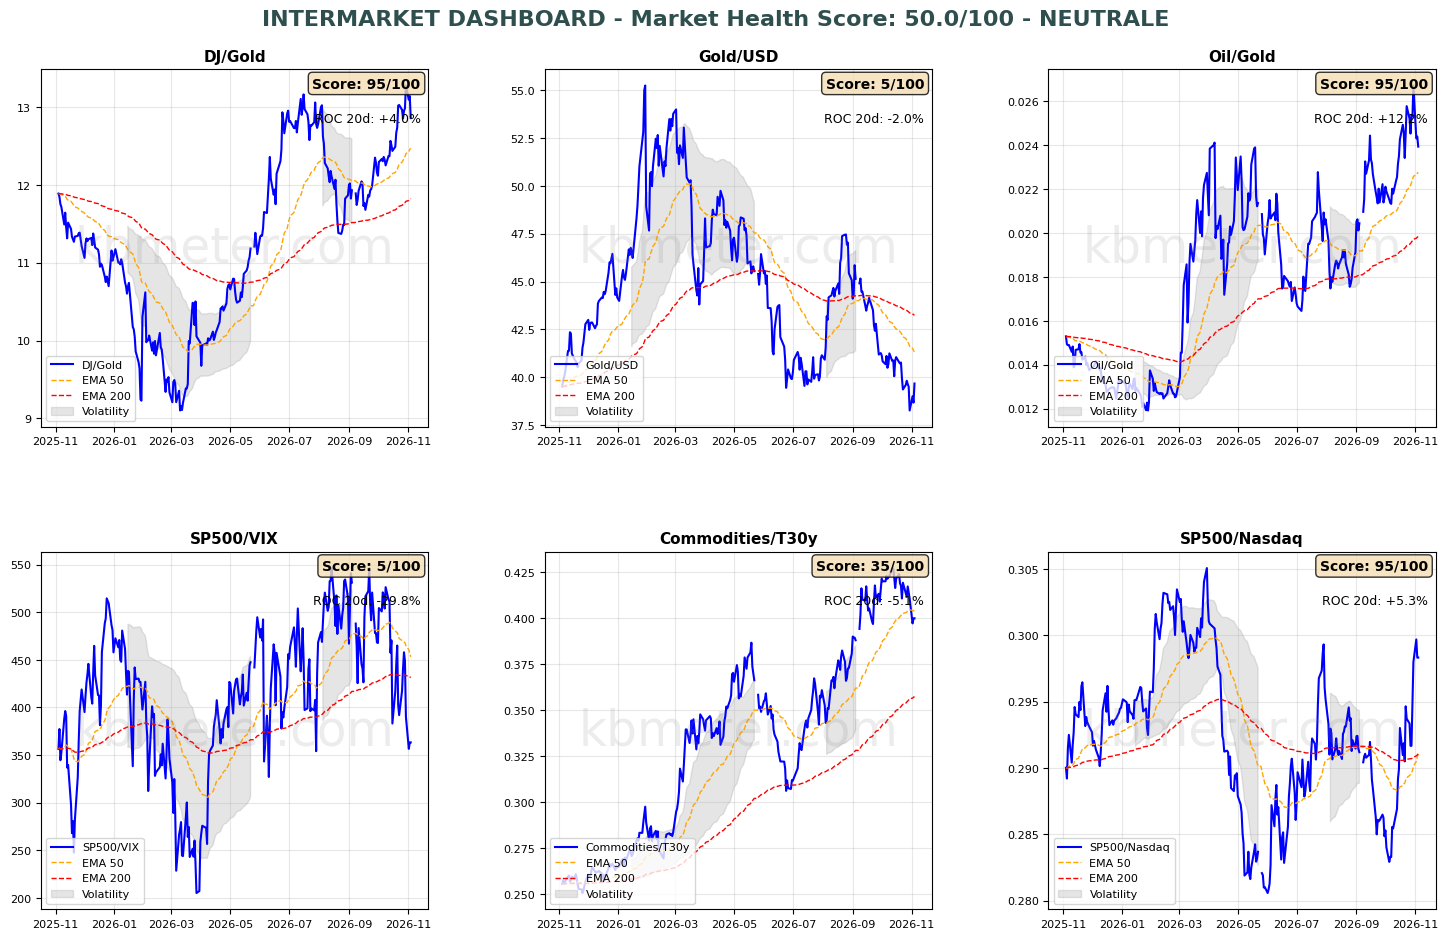
Financial markets are currently showing neutral sentiment. Intermarket analysis highlights a Market Health Score of 50/100. Our intermarket dashboards continue to point to a somewhat weakened risk appetite: the S&P 500/VIX ratio remains below its long-term moving average, while, conversely, the S&P 500/Nasdaq ratio remains above it. The main development is the upward move in gold, which is gaining ground against both the Dow Jones and the US dollar. Oil prices are falling on reports that negotiations between the US and Iran may still be possible, while the Commodities/Bonds ratio is stabilising below its medium-term moving average.
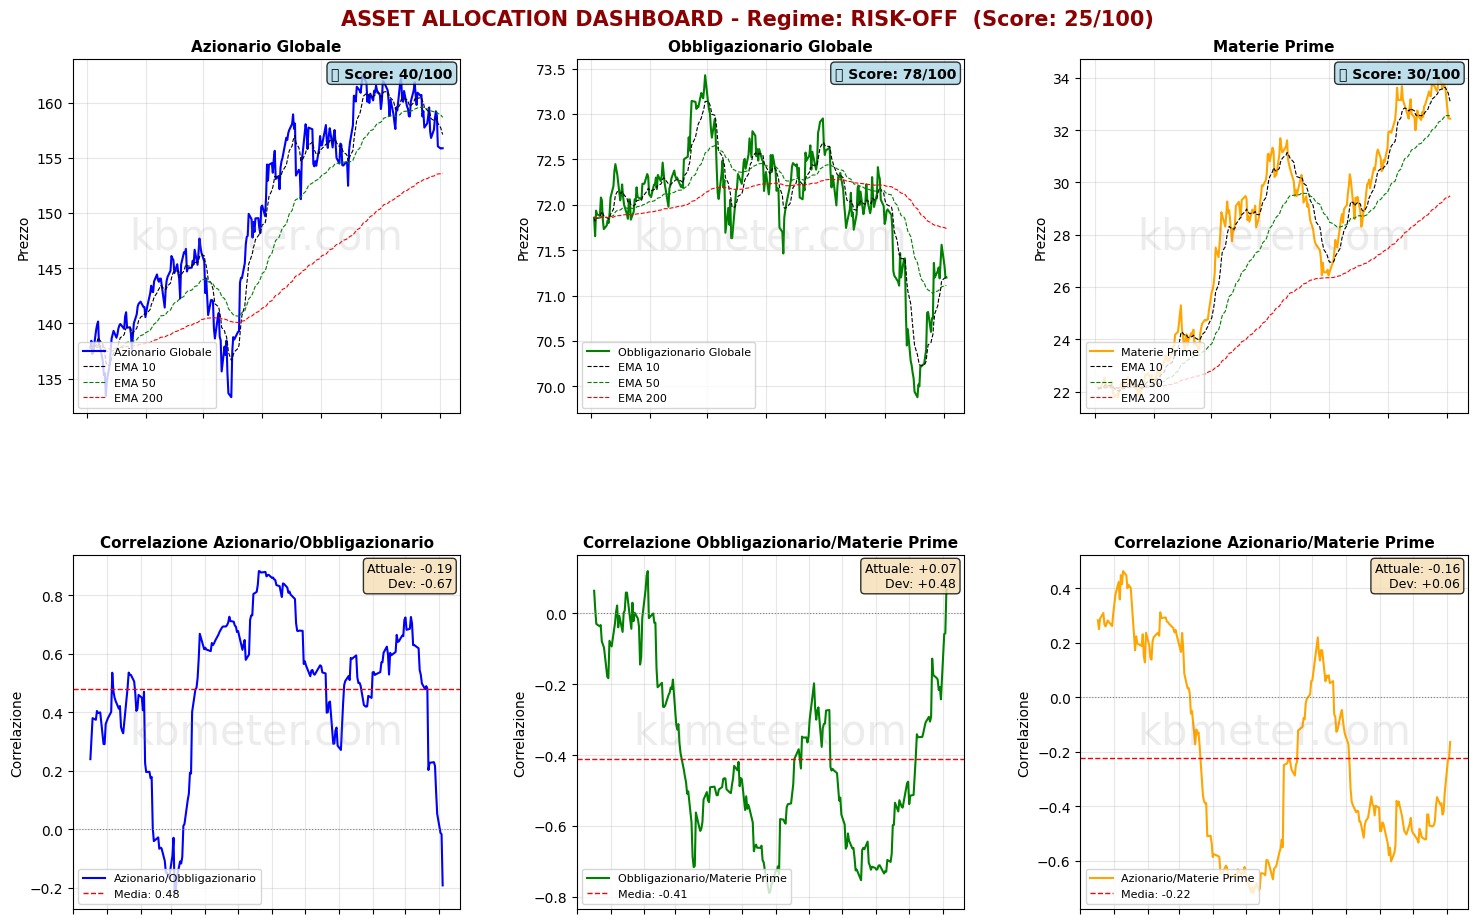
There have been few significant moves across asset classes. Bonds are finding support at their short-term moving average and remain within the range defined by their medium- and long-term moving averages. Equities are still trading below their medium-term moving average, while commodities are offsetting the decline in oil prices with gold’s recovery, remaining just below their medium-term moving average.
Our market weather map confirms the weakness in gold but also highlights a loss of momentum in the US dollar, whose Health Score has fallen back to its lowest levels since last September. Equities remain in neutral territory, although the gap between North America and Europe is widening.
Global Futures – Pre-Market Sentiment
Pre-Market Futures: Global futures point to a moderately risk-off sentiment (-0.34% on average), with the US slightly lower (-0.29%), Europe slightly lower (-0.49%) and Asia slightly lower (-0.18%).
📊 Global Futures – Pre-Market Sentiment
- Hang Seng: +1.55%
- Nifty 50: +0.28%
- Russell 2000: -0.02%
- Nikkei 225: -1.78%
- IBEX 35: -0.73%
- Taiwan: -0.67%
Macroeconomic calendar
Today’s macroeconomic calendar features the highly anticipated October 2026 inflation reading for the Eurozone. Also worth monitoring are the US ISM Services Index, the final Composite PMI readings and the performance of China’s private sector, according to S&P Global.
On the corporate earnings front, today’s reporting companies include BMW, BPER, Leonardo and Tenaris in Europe, and McDonald’s and Qualcomm in the US.
Assets to watch
Data as of Nov 3, 2026We have split the KBMeter scores into three bands, depending on their value: Weak, Intermediate or Strong. Here you can see which bands are most at risk of changing over the next 5 days and which ones hold.
The number on the right is the share of similar past cases in which the band had changed after 5 days. The higher it is, the more likely it is to change. The arrow in the current band appears when the asset is close to the border with the neighbouring band.
CONTINUE READING. ACTIVATE YOUR 14-DAY FREE TRIAL NOW. CLICK HERE
Already a subscriber? Login here
It does not say whether the price will rise or fall and it is not investment advice.
Already a subscriber? Login here
NOTES AND WARNINGS
Data compiled by kbmeter.com. Analysis date: 4 November 2026 - 8:28 AM GMT+1
This content is provided for informational purposes only and should not be considered financial advice. All scores and assessments are based on the previous trading day’s closing prices. Futures indications refer to the date and time of the analysis.