
August Opens with Neutral Market Sentiment; Global Bonds Eye Key Technical Cross, Gold, Dollar and Yen in Focus
August opens with market sentiment remaining in neutral territory, maintaining a risk-on bias while volatility stays around its historical average. The main source of concern continues to be the bond market, where the global bond index is approaching a potential bearish crossover between the 50-day and 200-day moving averages—a classic negative technical signal.
Fresh signs of diplomatic progress in the Middle East have eased pressure on the increasingly volatile energy sector. This week, it will also be worth closely monitoring the performance of Gold, the U.S. Dollar, and the Japanese Yen. Futures point to a positive opening for both European and U.S. equity markets.
Market Weather Map
August 3, 2026
US Equities
Eu Equities
Asia Equities
Commodities
Bonds
Dollar Index
Technology
Gold
Oil
Crypto
Market Summary
Do you want to see the score details for all assets monitored by KBMeter?
Try free for 14 days →Financial markets sentiment
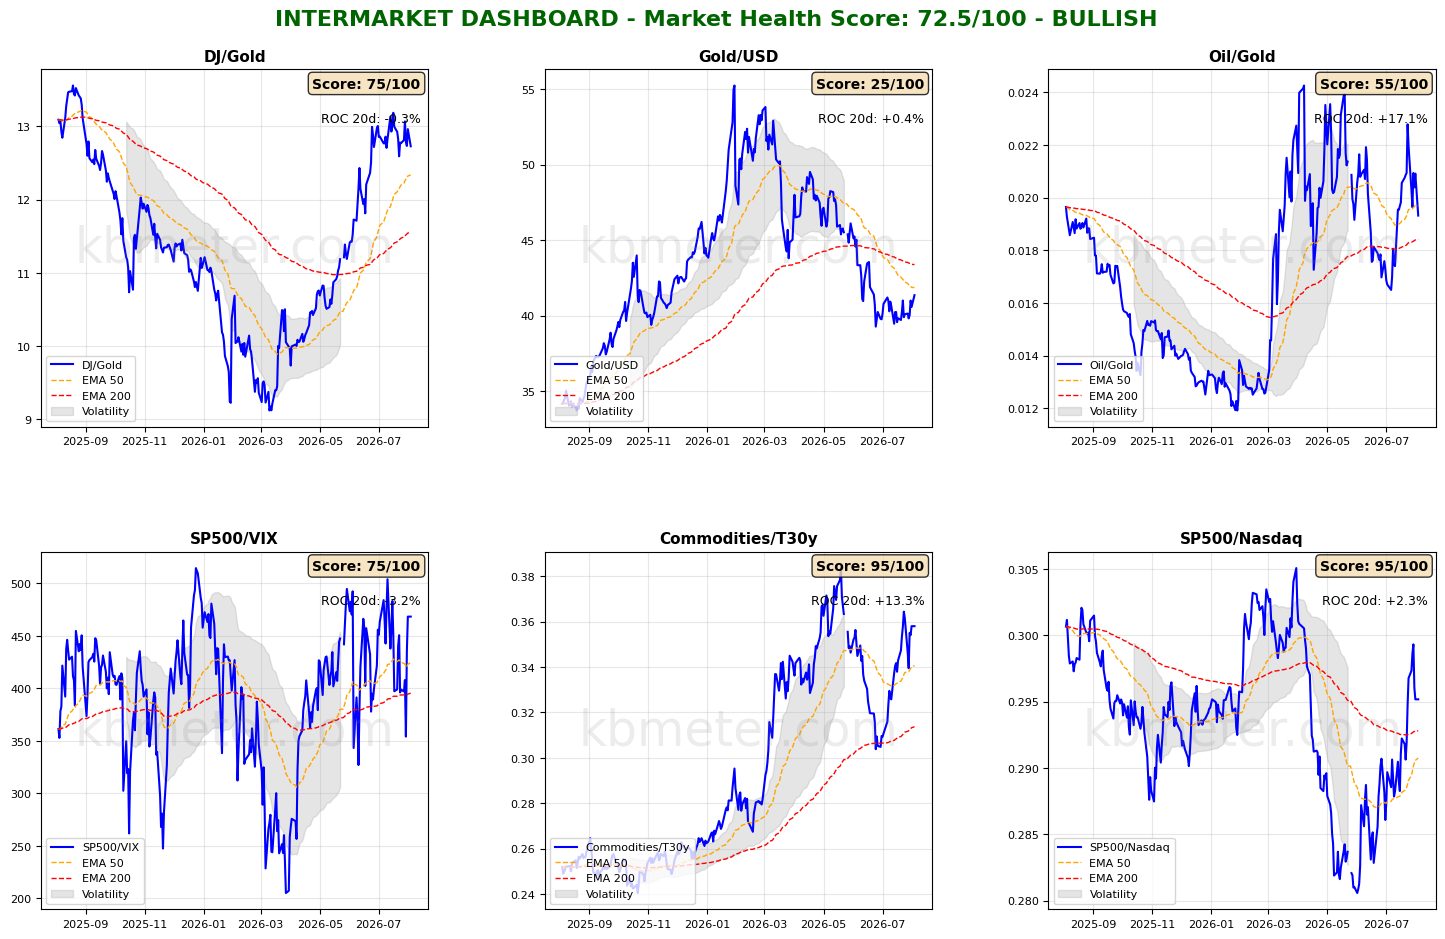
Financial markets currently display a neutral overall sentiment. Our intermarket analysis shows a Market Health Score of 72/100, indicating a positive underlying environment. Looking at our intermarket dashboards, there are three key developments to watch this week.
The first concerns the Gold/U.S. Dollar ratio. As highlighted in previous reports, the strength of the U.S. dollar relative to gold has weakened over recent weeks. The ratio is now attempting to recover and is approaching the resistance represented by the medium-term moving average. It will be important to see whether it is rejected at this level or manages to break above it.
The second area of focus is the S&P 500/Nasdaq ratio. The ratio has returned to its April highs, and the next technical milestone confirming the upward trend would be a bullish crossover of the 50-day and 200-day moving averages.
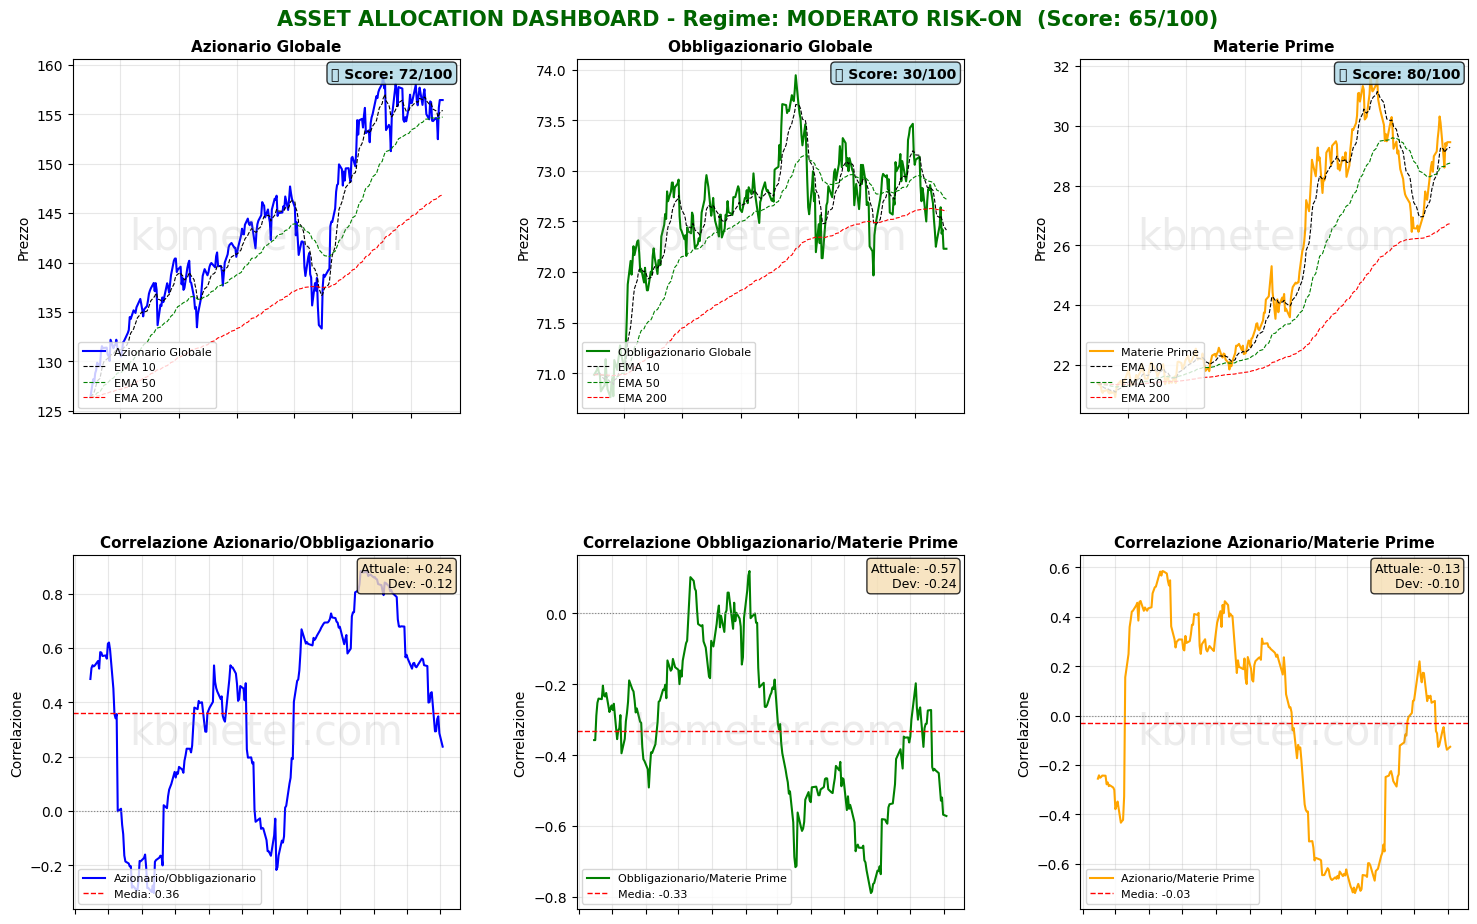
The third key element concerns global fixed income. The broad sideways trading range is currently testing the lower boundary of its channel, while the 50-day and 200-day moving averages continue to converge. A bearish crossover between these two averages would represent a significant negative technical signal.
Elsewhere, the Dow/Gold ratio remains broadly stable in risk-on territory, as does the S&P 500/VIX ratio. Global equities continue to lack clear directional momentum, while commodities remain heavily influenced by the extreme volatility in the energy sector.
Our market weather map confirms the picture seen so far: equities remain in neutral territory, with Europe maintaining a slight edge over North America and Asia. Fixed income remains weak, the U.S. dollar is below the 50-point threshold, and U.S. technology stocks are recovering but still trading below the 50-point mark.
As for gold, we highlight the nearly 20-point increase in the Outlook component over the past week. The Japanese yen also deserves close attention following coordinated interventions by Japan and the United States aimed at supporting the currency. Investors appear to be anticipating further moves. The USD/JPY exchange rate has recorded a 9-point decline in its daily score, with momentum slipping into negative territory.
Global Futures – Pre-Market Sentiment
Pre-Market Futures. Global equity futures indicate a risk-on sentiment (average +0.67%), led by the U.S. (+0.73%), followed by Asia (+0.65%) and Europe (+0.57%).
📊 Global Futures – Pre-Market Sentiment
- Nikkei 225: +1.23%
- Nifty 50: +1.23%
- DAX: +1.08%
- Hang Seng: -0.06%
- IBEX 35: +0.09%
- FTSE MIB: +0.13%
Macroeconomic calendar
On the macroeconomic front, August begins with the release of the final July PMI survey data, along with the July update of the U.S. ISM Manufacturing Index.
On the earnings front, today’s highlights include results from Berkshire Hathaway and Palantir Technologies.
Already a subscriber? Login here
NOTES AND WARNINGS
Data compiled by kbmeter.com. Analysis date: 3 August 2026 - 7:20 AM GMT+1
This content is provided for informational purposes only and should not be considered financial advice. All scores and assessments are based on the previous trading day’s closing prices. Futures indications refer to the date and time of the analysis.
