
Another High-Stakes Week for Markets: Tech Sector and Fed Rate Hike Bets in Focus
Another week in which the technology sector, oil, gold and the US dollar will remain the most reliable indicators for gauging sentiment across financial markets. Market sentiment remains moderately negative, with volatility edging slightly higher. On the technology front, the main talking points will be Anthropic’s IPO (along with lingering questions following the sell-off) and Nvidia’s potential industrial espionage controversy.
On the macroeconomic front, the week will bring October inflation figures (CPI and PPI) from the United States, data that could strengthen expectations of another interest rate hike before year-end. Meanwhile, geopolitical uncertainties and their implications for oil prices and commodities remain firmly in the background. Futures point to a positive opening in the US and a negative start in Europe.
Market Weather Map
November 9, 2026
US Equities
Eu Equities
Asia Equities
Commodities
Bonds
Dollar Index
Technology
Gold
Oil
Crypto
Market Summary
Do you want to see the score details for all assets monitored by KBMeter?
Try free for 14 days →Financial markets sentiment
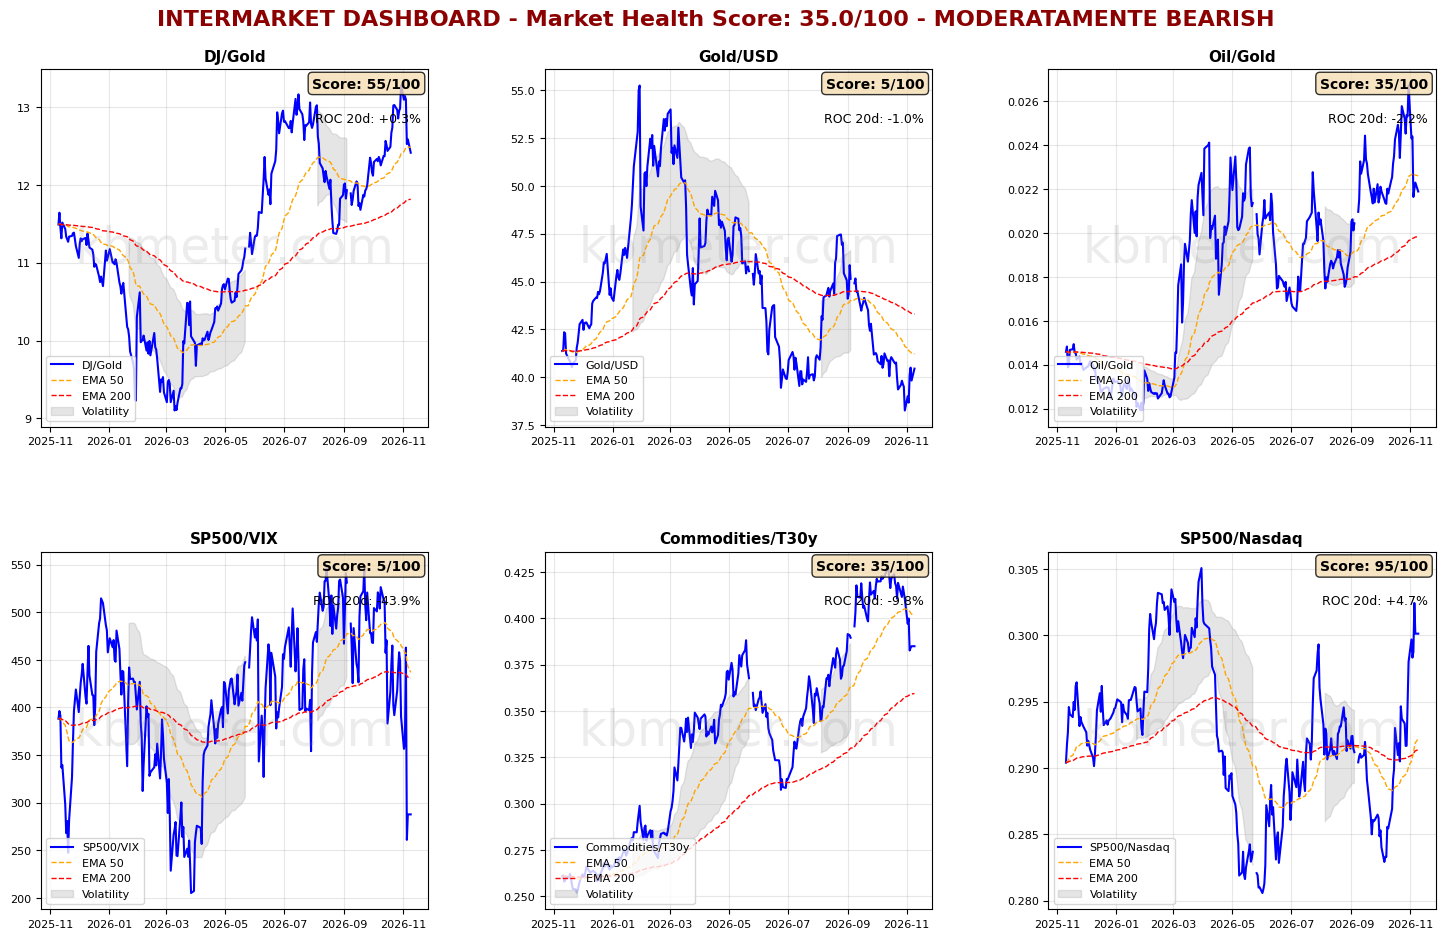
Financial markets are currently showing a moderately negative sentiment. Intermarket analysis points to a Market Health Score of 35/100.
The week begins with our intermarket dashboards once again signalling caution. Risk appetite indicators have delivered the clearest warning signals.
The S&P 500/VIX ratio remains below its long-term moving average and close to its lowest levels since last spring. The Dow/Gold ratio has slipped below its medium-term moving average, despite gold bullion losing some momentum in its recovery following the latest US labour market data. The S&P 500/Nasdaq ratio remains near its highest levels since last May.
The Commodities/Bonds ratio is also indirectly signalling caution, although the recent recovery in US Treasuries has coincided with a weakening in oil prices (the Oil/Gold ratio remains below its medium-term moving average).
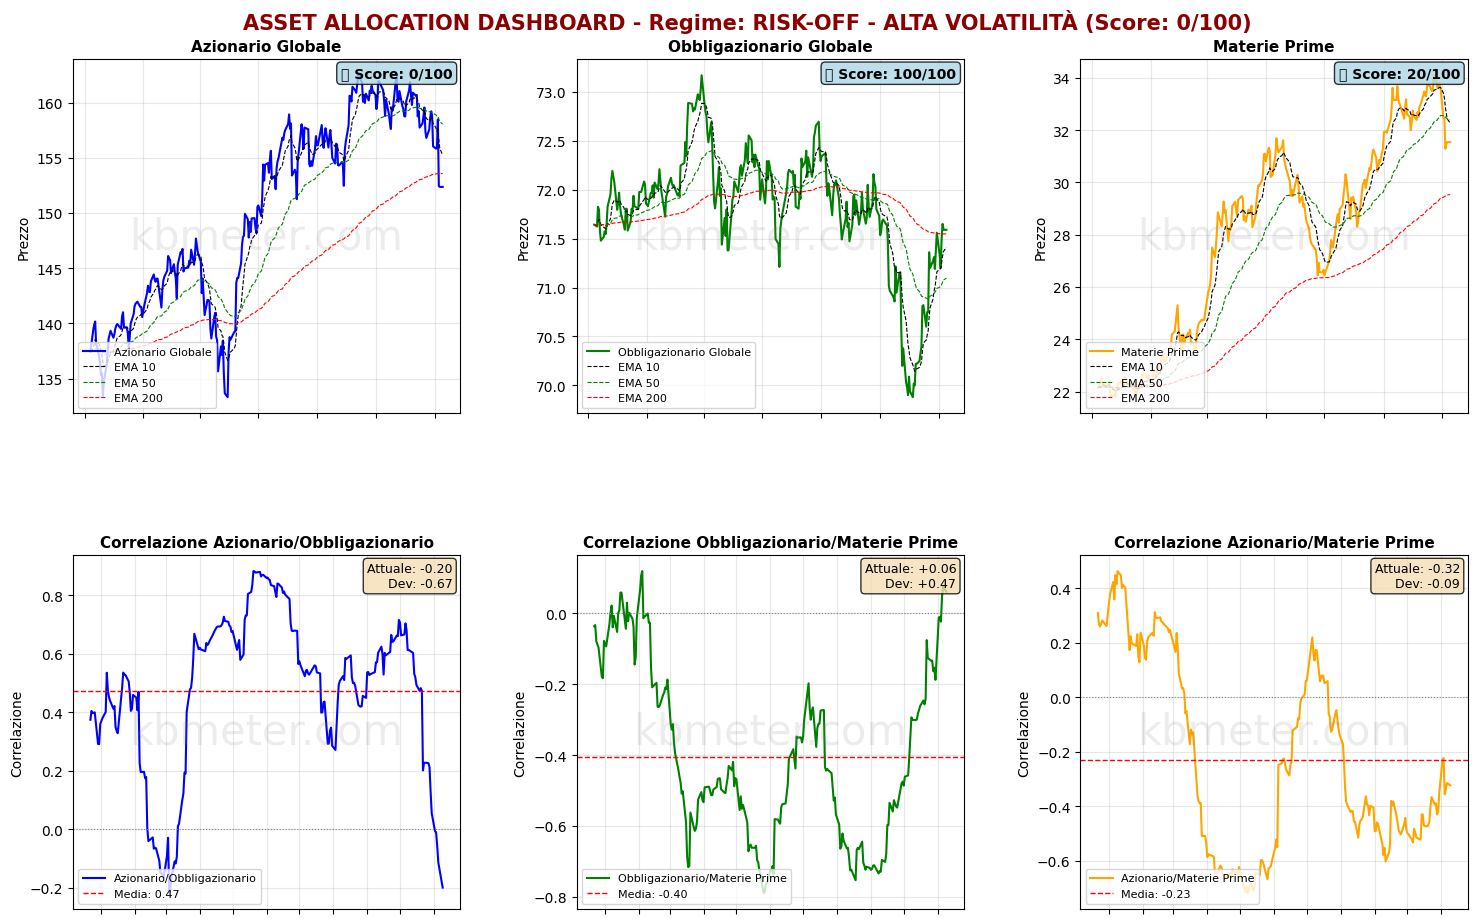
Asset classes confirm this picture. Global equities begin the week below their long-term moving average, within a medium-term static support area. Global bonds are testing their long-term moving average, in an attempt to confirm the upward crossover that began towards the end of last week. Commodities remain below their medium-term moving average and within a medium- to long-term support zone.
Our market weather map shows equities still in neutral territory, although two components – North America and Asia – have fallen below the 50-point threshold. The US technology sector is under pressure, while the US dollar is strengthening again on expectations of a potential Fed rate hike, a factor that is preventing gold from extending its recovery. Bonds remain stable above the 50-point threshold.
Global Futures – Pre-Market Sentiment
Pre-Market Futures: Global futures point to a moderately risk-on sentiment (+0.15% on average), with the US slightly positive (+0.45%), Europe negative (-0.56%) and Asia slightly negative (-0.20%).
📊 Global Futures – Pre-Market Sentiment
- Taiwan: +4.56%
- Nikkei 225: +1.22%
- USA 30: +0.73%
- FTSE MIB: -1.41%
- CSI 300: -1.34%
- CAC 40: -1.17%
Macroeconomic calendar
On the macroeconomic front, today’s agenda includes China’s October 2026 inflation data, Germany’s September international trade update, and US consumer inflation expectations for October 2026.
Assets to watch
Data as of Nov 6, 2026We have split the KBMeter scores into three bands, depending on their value: Weak, Intermediate or Strong. Here you can see which bands are most at risk of changing over the next 5 days and which ones hold.
The number on the right is the share of similar past cases in which the band had changed after 5 days. The higher it is, the more likely it is to change. The arrow in the current band appears when the asset is close to the border with the neighbouring band.
CONTINUE READING. ACTIVATE YOUR 14-DAY FREE TRIAL NOW. CLICK HERE
Already a subscriber? Login here
It does not say whether the price will rise or fall and it is not investment advice.
Already a subscriber? Login here
NOTES AND WARNINGS
Data compiled by kbmeter.com. Analysis date: 9 November 2026 - 7:30 AM GMT+1
This content is provided for informational purposes only and should not be considered financial advice. All scores and assessments are based on the previous trading day’s closing prices. Futures indications refer to the date and time of the analysis.