U.S. Consumer Confidence: Intermarket Analysis Signals Deterioration in November 2025
As we do every month, let’s update the intermarket analysis related to U.S. consumer confidence. The main indicator has broken below the 50-day moving average, a sign of decreasing optimism among households.
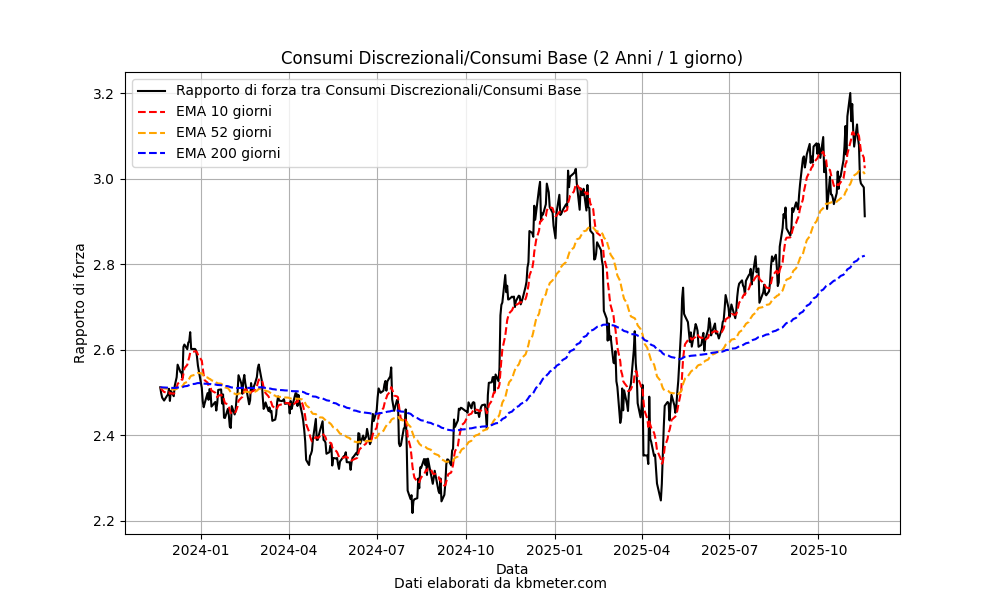
In the chart above, we can see the trend of the relative strength ratio between the U.S. consumer discretionary sector and the consumer staples sector. The indicator shows a sharp slowdown at the end of October, leading to a drop below the 50-day moving average. This could be a potential sign of a trend reversal, although it cannot be confirmed at this stage, but it does point to a worsening in U.S. household sentiment.
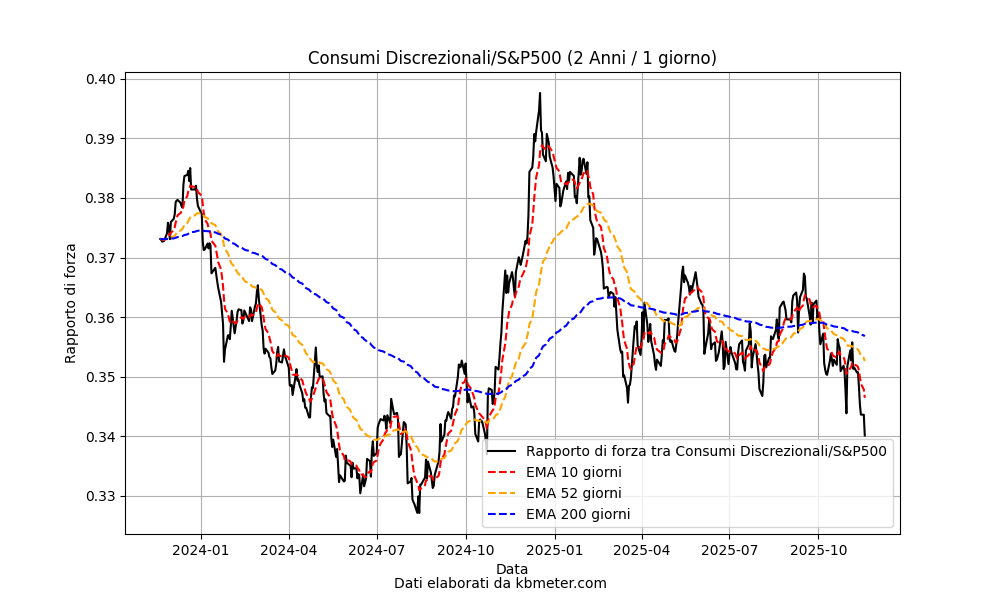
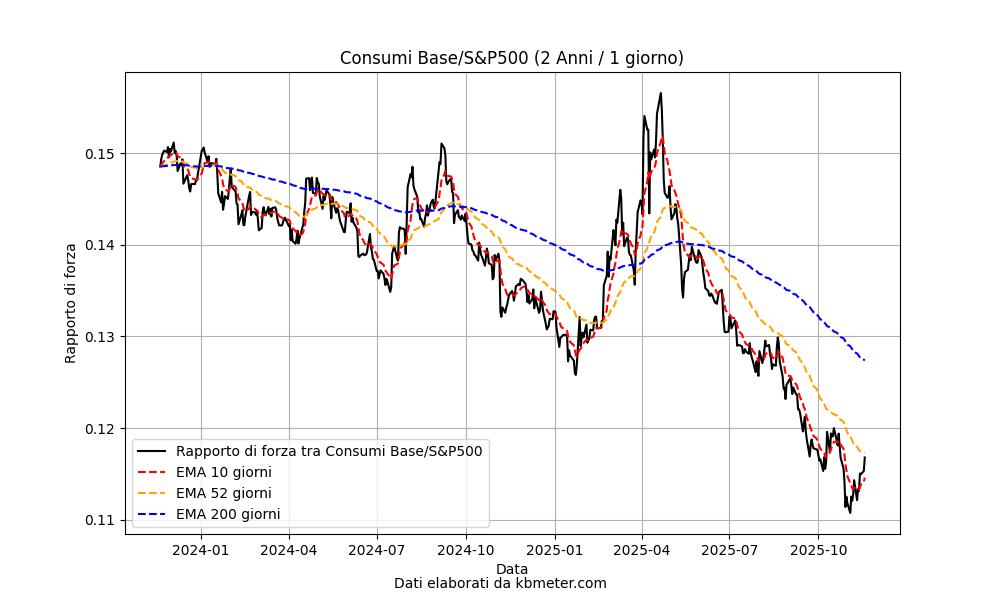
By analyzing the performance of the two sectors relative to the main index (the S&P 500), we find confirmation of the weakening in consumer discretionary. This movement began well before the slowdown mentioned earlier and has pushed the ratio below the long-term moving average. The setup is now technically bearish. At the same time—see the chart on the right—we note a rebound from two-year lows in the ratio between consumer staples and the index, with the indicator returning to the area of the 50-day moving average.