Tech and Semiconductors Power the U.S. Stock Market Rally
In recent days, the main U.S. stock indices have reached new all-time highs, but this strong performance is not reflected when analyzing the sectors that make up the S&P 500. This is not a contradiction, but rather a snapshot of the current market dynamic — an upward movement once again driven predominantly by the technology sector. We can observe this through two intermarket charts.
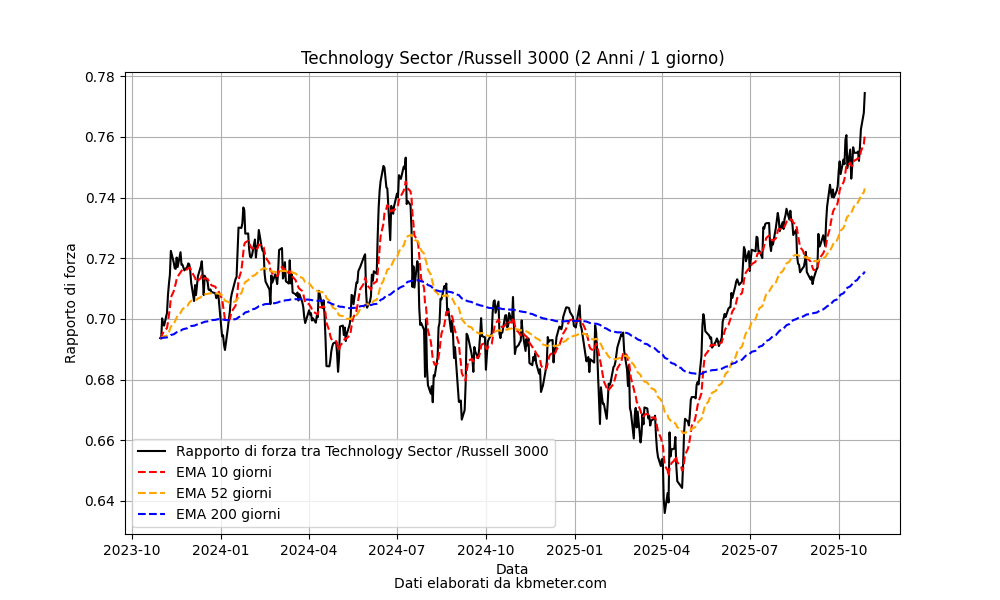
In the first chart, we look at the relative strength ratio between the technology sector of the S&P 500 and a broader index such as the Russell 3000. The chart clearly shows a strong phase for the tech sector, which since last April has moved above its long-term moving average and has significantly surpassed the highs reached in the summer of 2024. It is also worth noting that the indicator’s slope has increased in recent weeks.
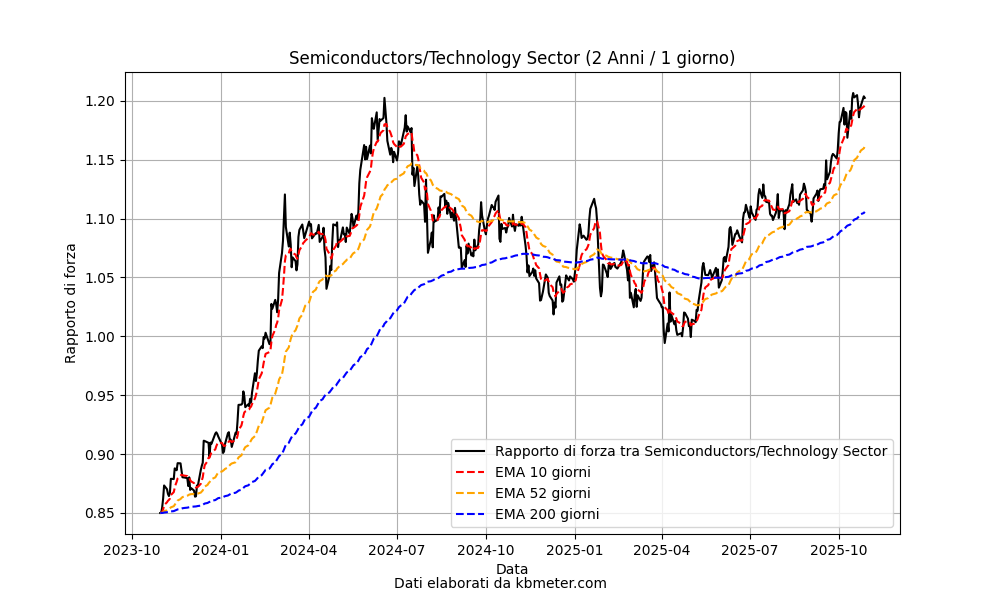
Within the technology sector, semiconductors are leading the way. This is evident in the following chart, which shows the relative strength ratio between semiconductors and the S&P 500 technology sector. Here again, we can see that in mid-summer a crucial crossing occurred between the 50-day and 200-day moving averages — a bullish signal that sparked the current upward trend, with the relative strength ratio now at its highest levels since the summer of 2024.