Saylor-Buffett Ratio Back to Dot-Com Bubble Levels in October 2025 — But Don’t Rush to Conclusions
One of the indicators often cited to assess the level of “riskiness” in the current equity rally is undoubtedly the Saylor-Buffett Ratio. We have already discussed it in our previous Insights, so let’s take a look at the updated situation as of October 2025.
Let’s start with the classic version of the indicator — the one that compares the market capitalization of MicroStrategy (the most prominent U.S. crypto treasury company) with that of Berkshire Hathaway (Warren Buffett’s firm).
A ratio above 1 signals a tendency toward riskier and more speculative stocks. During the 2000 market crisis (the dot-com bubble), the indicator spiked above 2 before falling in the following years below the threshold of 1.
Currently, MicroStrategy’s market capitalization is about 2.1 times that of Berkshire Hathaway. Statistically, this means that the Saylor-Buffett Ratio is now at the same levels reached back in 2000.
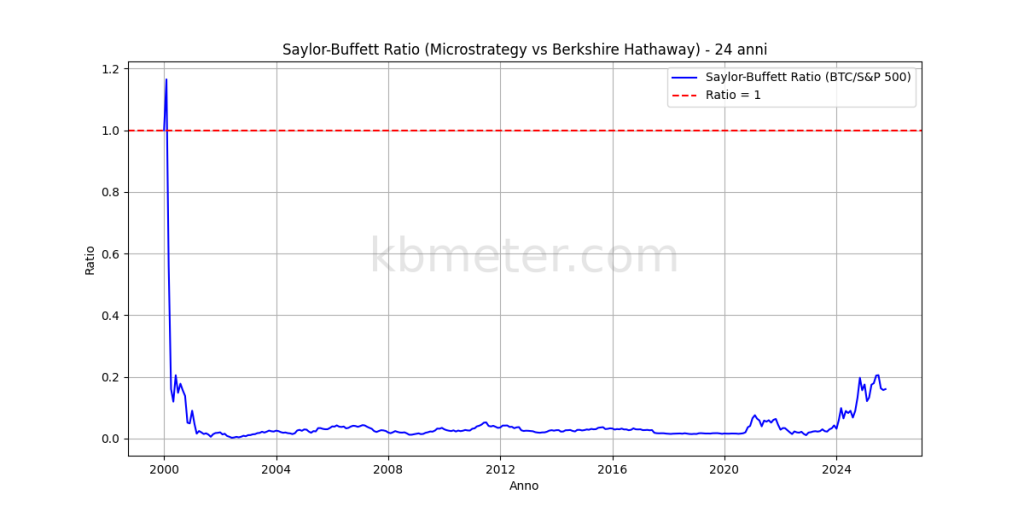
Above, we show the “intermarket” version of the ratio from 2000 to today, where we can see that the indicator is once again at its highest point since the burst of the dot-com bubble.
Of course, this is merely an indication of the current structure of the U.S. equity market, and it would be too simplistic to conclude that we are on the verge of another speculative bubble. Nevertheless, the statistical evidence does invite some reflection on the strategic choices needed to navigate this unprecedented phase in financial markets.